CommoVision

See the future in real time

Operator

Petróleos Mexicanos

Petróleos Mexicanos produced 585.0 MMbbl of oil and 1.63 Tcf of natural gas in 2025. 7,018 operated producing wells tracked, trailing 12 months per region.

  • Largest operator by operated oil in Mexico, 2025.
  • Operated 92.9% of the oil produced in Mexico, 2025.
  • Oil production fell 7% in 2025 from 2024.
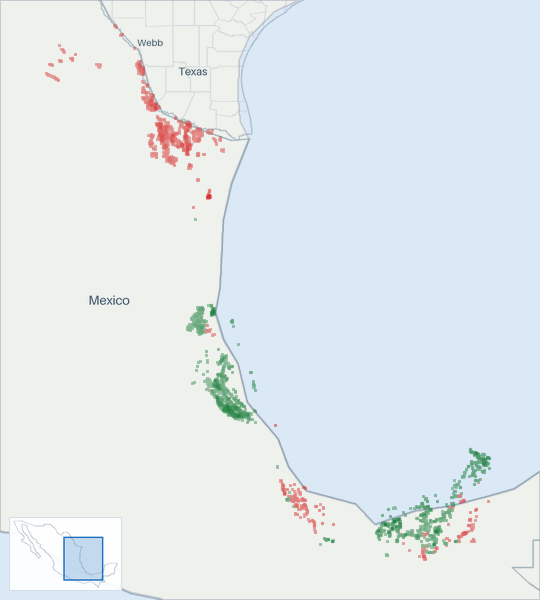
Well map of Petróleos Mexicanos. The full map is further down this page.

Production

Petróleos Mexicanos oil production (MMbbl/d, monthly average, grouped by when each well first produced)
Petróleos Mexicanos oil production: million barrels per day, by first-production vintage today 123 MMbbl/d 2017201820192020202120222023202420252026 Jun 2016: 2.18 MMbbl/d total Jul 2016: 2.16 MMbbl/d total Aug 2016: 2.14 MMbbl/d total Sep 2016: 2.11 MMbbl/d total Oct 2016: 2.1 MMbbl/d total Nov 2016: 2.07 MMbbl/d total Dec 2016: 2.03 MMbbl/d total Jan 2017: 2.02 MMbbl/d total Feb 2017: 2.01 MMbbl/d total Mar 2017: 2.02 MMbbl/d total Apr 2017: 2.01 MMbbl/d total May 2017: 2.02 MMbbl/d total Jun 2017: 2.01 MMbbl/d total Jul 2017: 1.98 MMbbl/d total Aug 2017: 1.93 MMbbl/d total Sep 2017: 1.73 MMbbl/d total Oct 2017: 1.9 MMbbl/d total Nov 2017: 1.86 MMbbl/d total Dec 2017: 1.87 MMbbl/d total Jan 2018: 1.92 MMbbl/d total Feb 2018: 1.89 MMbbl/d total Mar 2018: 1.84 MMbbl/d total Apr 2018: 1.86 MMbbl/d total May 2018: 1.85 MMbbl/d total Jun 2018: 1.83 MMbbl/d total Jul 2018: 1.82 MMbbl/d total Aug 2018: 1.79 MMbbl/d total Sep 2018: 1.79 MMbbl/d total Oct 2018: 1.74 MMbbl/d total Nov 2018: 1.69 MMbbl/d total Dec 2018: 1.7 MMbbl/d total Jan 2019: 1.61 MMbbl/d total Feb 2019: 1.69 MMbbl/d total Mar 2019: 1.68 MMbbl/d total Apr 2019: 1.66 MMbbl/d total May 2019: 1.65 MMbbl/d total Jun 2019: 1.66 MMbbl/d total Jul 2019: 1.66 MMbbl/d total Aug 2019: 1.67 MMbbl/d total Sep 2019: 1.69 MMbbl/d total Oct 2019: 1.65 MMbbl/d total Nov 2019: 1.69 MMbbl/d total Dec 2019: 1.69 MMbbl/d total Jan 2020: 1.71 MMbbl/d total Feb 2020: 1.72 MMbbl/d total Mar 2020: 1.73 MMbbl/d total Apr 2020: 1.71 MMbbl/d total May 2020: 1.64 MMbbl/d total Jun 2020: 1.62 MMbbl/d total Jul 2020: 1.61 MMbbl/d total Aug 2020: 1.65 MMbbl/d total Sep 2020: 1.66 MMbbl/d total Oct 2020: 1.64 MMbbl/d total Nov 2020: 1.65 MMbbl/d total Dec 2020: 1.68 MMbbl/d total Jan 2021: 1.68 MMbbl/d total Feb 2021: 1.69 MMbbl/d total Mar 2021: 1.72 MMbbl/d total Apr 2021: 1.71 MMbbl/d total May 2021: 1.71 MMbbl/d total Jun 2021: 1.72 MMbbl/d total Jul 2021: 1.73 MMbbl/d total Aug 2021: 1.69 MMbbl/d total Sep 2021: 1.74 MMbbl/d total Oct 2021: 1.73 MMbbl/d total Nov 2021: 1.73 MMbbl/d total Dec 2021: 1.73 MMbbl/d total Jan 2022: 1.74 MMbbl/d total Feb 2022: 1.72 MMbbl/d total Mar 2022: 1.74 MMbbl/d total Apr 2022: 1.73 MMbbl/d total May 2022: 1.73 MMbbl/d total Jun 2022: 1.75 MMbbl/d total Jul 2022: 1.76 MMbbl/d total Aug 2022: 1.74 MMbbl/d total Sep 2022: 1.74 MMbbl/d total Oct 2022: 1.75 MMbbl/d total Nov 2022: 1.76 MMbbl/d total Dec 2022: 1.78 MMbbl/d total Jan 2023: 1.83 MMbbl/d total Feb 2023: 1.83 MMbbl/d total Mar 2023: 1.84 MMbbl/d total Apr 2023: 1.86 MMbbl/d total May 2023: 1.86 MMbbl/d total Jun 2023: 1.86 MMbbl/d total Jul 2023: 1.81 MMbbl/d total Aug 2023: 1.83 MMbbl/d total Sep 2023: 1.84 MMbbl/d total Oct 2023: 1.82 MMbbl/d total Nov 2023: 1.82 MMbbl/d total Dec 2023: 1.8 MMbbl/d total Jan 2024: 1.79 MMbbl/d total Feb 2024: 1.78 MMbbl/d total Mar 2024: 1.77 MMbbl/d total Apr 2024: 1.75 MMbbl/d total May 2024: 1.75 MMbbl/d total Jun 2024: 1.75 MMbbl/d total Jul 2024: 1.74 MMbbl/d total Aug 2024: 1.73 MMbbl/d total Sep 2024: 1.71 MMbbl/d total Oct 2024: 1.68 MMbbl/d total Nov 2024: 1.64 MMbbl/d total Dec 2024: 1.59 MMbbl/d total Jan 2025: 1.59 MMbbl/d total Feb 2025: 1.58 MMbbl/d total Mar 2025: 1.58 MMbbl/d total Apr 2025: 1.6 MMbbl/d total May 2025: 1.6 MMbbl/d total Jun 2025: 1.6 MMbbl/d total Jul 2025: 1.62 MMbbl/d total Aug 2025: 1.61 MMbbl/d total Sep 2025: 1.62 MMbbl/d total Oct 2025: 1.61 MMbbl/d total Nov 2025: 1.61 MMbbl/d total Dec 2025: 1.63 MMbbl/d total Jan 2026: 1.62 MMbbl/d total Feb 2026: 1.62 MMbbl/d total Mar 2026: 1.63 MMbbl/d total Apr 2026: 1.62 MMbbl/d total May 2026: 1.63 MMbbl/d total

Still arriving: Jun 2026 <1% filed, Jul 2026 <1% filed, Aug 2026 <1% filed.

All from what the source published. 50.4% held at well grain.

How the volume breaks down
  • 50.4% Reported by the official source by well
  • 49.6% Reported by the official source as a lease, facility, field or state total. Published without per-well detail.

Every barrel here starts from what the official source published for the months measured. Measured over January 1960 to May 2026.

The gray “Reported without well detail” band is volume the source reports above the well: fields, facilities, or leases the source publishes as one total. It is included so the stack still sums to the whole entity.

Petróleos Mexicanos natural gas production (Bcf/d, monthly average, grouped by when each well first produced)
Petróleos Mexicanos natural gas production: billion cubic feet per day, by first-production vintage today 2468 Bcf/d 2017201820192020202120222023202420252026 Jun 2016: 5.79 Bcf/d total Jul 2016: 5.69 Bcf/d total Aug 2016: 5.6 Bcf/d total Sep 2016: 5.53 Bcf/d total Oct 2016: 5.49 Bcf/d total Nov 2016: 5.43 Bcf/d total Dec 2016: 5.3 Bcf/d total Jan 2017: 5.25 Bcf/d total Feb 2017: 5.22 Bcf/d total Mar 2017: 5.3 Bcf/d total Apr 2017: 5.25 Bcf/d total May 2017: 5.22 Bcf/d total Jun 2017: 5.17 Bcf/d total Jul 2017: 5.14 Bcf/d total Aug 2017: 4.96 Bcf/d total Sep 2017: 4.24 Bcf/d total Oct 2017: 4.69 Bcf/d total Nov 2017: 4.73 Bcf/d total Dec 2017: 4.74 Bcf/d total Jan 2018: 4.83 Bcf/d total Feb 2018: 4.77 Bcf/d total Mar 2018: 4.47 Bcf/d total Apr 2018: 4.69 Bcf/d total May 2018: 4.66 Bcf/d total Jun 2018: 4.68 Bcf/d total Jul 2018: 4.7 Bcf/d total Aug 2018: 4.73 Bcf/d total Sep 2018: 4.75 Bcf/d total Oct 2018: 4.72 Bcf/d total Nov 2018: 4.59 Bcf/d total Dec 2018: 4.69 Bcf/d total Jan 2019: 4.46 Bcf/d total Feb 2019: 4.68 Bcf/d total Mar 2019: 4.66 Bcf/d total Apr 2019: 4.63 Bcf/d total May 2019: 4.64 Bcf/d total Jun 2019: 4.63 Bcf/d total Jul 2019: 4.67 Bcf/d total Aug 2019: 4.7 Bcf/d total Sep 2019: 4.77 Bcf/d total Oct 2019: 4.72 Bcf/d total Nov 2019: 4.77 Bcf/d total Dec 2019: 4.78 Bcf/d total Jan 2020: 4.75 Bcf/d total Feb 2020: 4.69 Bcf/d total Mar 2020: 4.69 Bcf/d total Apr 2020: 4.58 Bcf/d total May 2020: 4.22 Bcf/d total Jun 2020: 4.51 Bcf/d total Jul 2020: 4.66 Bcf/d total Aug 2020: 4.68 Bcf/d total Sep 2020: 4.69 Bcf/d total Oct 2020: 4.7 Bcf/d total Nov 2020: 4.54 Bcf/d total Dec 2020: 4.62 Bcf/d total Jan 2021: 4.63 Bcf/d total Feb 2021: 4.64 Bcf/d total Mar 2021: 4.62 Bcf/d total Apr 2021: 4.46 Bcf/d total May 2021: 4.52 Bcf/d total Jun 2021: 4.52 Bcf/d total Jul 2021: 4.52 Bcf/d total Aug 2021: 4.45 Bcf/d total Sep 2021: 4.53 Bcf/d total Oct 2021: 4.51 Bcf/d total Nov 2021: 4.54 Bcf/d total Dec 2021: 4.49 Bcf/d total Jan 2022: 4.51 Bcf/d total Feb 2022: 4.44 Bcf/d total Mar 2022: 4.56 Bcf/d total Apr 2022: 4.54 Bcf/d total May 2022: 4.5 Bcf/d total Jun 2022: 4.54 Bcf/d total Jul 2022: 4.62 Bcf/d total Aug 2022: 4.6 Bcf/d total Sep 2022: 4.6 Bcf/d total Oct 2022: 4.6 Bcf/d total Nov 2022: 4.65 Bcf/d total Dec 2022: 4.65 Bcf/d total Jan 2023: 4.76 Bcf/d total Feb 2023: 4.79 Bcf/d total Mar 2023: 4.84 Bcf/d total Apr 2023: 4.9 Bcf/d total May 2023: 4.84 Bcf/d total Jun 2023: 4.84 Bcf/d total Jul 2023: 4.74 Bcf/d total Aug 2023: 4.76 Bcf/d total Sep 2023: 4.79 Bcf/d total Oct 2023: 4.76 Bcf/d total Nov 2023: 4.69 Bcf/d total Dec 2023: 4.6 Bcf/d total Jan 2024: 4.59 Bcf/d total Feb 2024: 4.59 Bcf/d total Mar 2024: 4.58 Bcf/d total Apr 2024: 4.32 Bcf/d total May 2024: 4.31 Bcf/d total Jun 2024: 4.42 Bcf/d total Jul 2024: 4.39 Bcf/d total Aug 2024: 4.35 Bcf/d total Sep 2024: 4.34 Bcf/d total Oct 2024: 4.33 Bcf/d total Nov 2024: 4.26 Bcf/d total Dec 2024: 4.25 Bcf/d total Jan 2025: 4.23 Bcf/d total Feb 2025: 4.28 Bcf/d total Mar 2025: 4.29 Bcf/d total Apr 2025: 4.35 Bcf/d total May 2025: 4.4 Bcf/d total Jun 2025: 4.41 Bcf/d total Jul 2025: 4.46 Bcf/d total Aug 2025: 4.47 Bcf/d total Sep 2025: 4.61 Bcf/d total Oct 2025: 4.64 Bcf/d total Nov 2025: 4.64 Bcf/d total Dec 2025: 4.67 Bcf/d total Jan 2026: 4.69 Bcf/d total Feb 2026: 4.66 Bcf/d total Mar 2026: 4.71 Bcf/d total Apr 2026: 4.72 Bcf/d total May 2026: 4.77 Bcf/d total

Still arriving: Jun 2026 <1% filed, Jul 2026 <1% filed, Aug 2026 <1% filed.

All from what the source published. 56.0% held at well grain.

How the volume breaks down
  • 56.0% Reported by the official source by well
  • 44.0% Reported by the official source as a lease, facility, field or state total. Published without per-well detail.

Every cubic foot here starts from what the official source published for the months measured. Measured over January 1960 to May 2026.

The gray “Reported without well detail” band is volume the source reports above the well: fields, facilities, or leases the source publishes as one total. It is included so the stack still sums to the whole entity.

The bands group wells by when they first produced.

About this chart

The stack shows what is holding today's rate up and how much of it is new drilling. The bands draw the filings already in.

These volumes are the production from the wells and facilities this company operates. Ownership works differently: other parties hold interests in these wells, and this company holds interests in wells that other companies operate. How we attribute production to a company

Annual table (full history)

best estimate incl. unsplit totals

YearOil (MMbbl)Gas produced (Bcf)
2025585.01,626
2024630.81,608
2023669.41,742
2022636.51,668
2021626.11,655
2020610.11,688
2019608.01,706
2018660.01,712
2017710.51,822
2016788.02,087
2015832.92,336
2014891.32,383
2013923.42,322
2012935.32,333
2011934.32,403
2010942.22,556
2009950.92,561
20081,020.72,526
20071,121.62,204
20061,187.61,949
20051,216.71,750
20041,238.21,667
20031,231.31,639
20021,159.21,613
20011,141.51,645
20001,103.31,711
19991,060.71,749
19981,120.71,749
19971,103.11,631
19961,046.11,535
1995955.31,372
1994980.11,323
1993975.81,305
1992976.41,312
1991976.71,326
1990930.01,333
1989917.41,304
1988917.11,273
1987927.31,277
1986886.11,252
1985960.11,315
1984982.51,374
1983972.91,480
19821,002.41,550
1981843.91,482
1980708.51,299
1979533.31,065
1978441.4935
1977357.9747
1976293.1772
1975261.5783
1974209.8741
1973164.9675
1972161.3658
1971155.4641
1970156.3665
1969149.6603
1968142.2572
1967132.9568
1966120.9524
1965117.9488
1964115.6480
1963114.8396
1962111.8365
1961106.8355
196099.0335

Source: CommoVision (commovision.com)

Monthly table (last 24 months)
MonthOil (Mbbl)Gas produced (MMcf)
2026-0550,422.6147,749
2026-0448,695.9141,688
2026-0350,432.6145,860
2026-0245,264.7130,343
2026-0150,361.8145,235
2025-1250,534.5144,859
2025-1148,262.2139,213
2025-1049,896.6143,958
2025-0948,587.1138,190
2025-0849,985.4138,581
2025-0750,046.2138,268
2025-0647,831.1132,207
2025-0549,649.0136,450
2025-0447,868.3130,642
2025-0348,821.4133,105
2025-0244,395.4119,888
2025-0149,139.8131,126
2024-1249,258.9131,771
2024-1149,299.0127,810
2024-1052,212.3134,214
2024-0951,397.0130,288
2024-0853,742.8134,993
2024-0753,823.7136,005
2024-0652,363.7132,620

Source: CommoVision (commovision.com)

Source: CommoVision · Petróleos Mexicanos, data through May 2026.

Well map

A map of 17,134 well locations operated by Petróleos Mexicanos for which CommoVision holds a published surface coordinate, each drawn where it is and colored by its primary product (green for oil, red for natural gas, gray where undetermined; a spot shared by more than one product shows the one with the most wells there), on a ground of land and water over faint country, state and county outlines and place names for orientation, with a small inset map locating this frame in Mexico.
  • Oil 11,183
  • Natural gas 5,951
17,134 well locations operated by Petróleos Mexicanos, colored by primary product.
About this map

Undetermined means not enough signal to settle it. Producing wells are the ones that reported oil or gas in the trailing 12 months per region.

1.63 MMbbl/d May 2026 oil production +1.6% vs May last year
4.77 Bcf/d May 2026 gas production +8.3% vs May last year
1.6 MMbbl/d 2025 oil production
4.46 Bcf/d 2025 gas production
7,018 wells Operated producing wells tracked trailing 12 months per region

Type curves

Petróleos Mexicanos oil type curves (bbl/d per well, log scale, against months on production; cohorts 2010–2026)
Petróleos Mexicanos oil type curves: average barrels per day per well on a log scale against months on production 2010-2014: 4,389 wells; starts at 182 bbl/d per well, 622 Mbbl cumulative through month 138 (100% of its wells old enough at that month); the dashed curve runs through month 198, on our forecast where a well’s own record ends2015: 286 wells; starts at 428 bbl/d per well, 1,565 Mbbl cumulative through month 126 (100% of its wells old enough at that month); the dashed curve runs through month 186, on our forecast where a well’s own record ends2016: 142 wells; starts at 687 bbl/d per well, 2,583 Mbbl cumulative through month 114 (100% of its wells old enough at that month); the dashed curve runs through month 174, on our forecast where a well’s own record ends2017: 62 wells; starts at 845 bbl/d per well, 3,313 Mbbl cumulative through month 102 (100% of its wells old enough at that month); the dashed curve runs through month 162, on our forecast where a well’s own record ends2018: 139 wells; starts at 439 bbl/d per well, 1,237 Mbbl cumulative through month 90 (100% of its wells old enough at that month); the dashed curve runs through month 150, on our forecast where a well’s own record ends2019: 204 wells; starts at 575 bbl/d per well, 1,540 Mbbl cumulative through month 78 (100% of its wells old enough at that month); the dashed curve runs through month 85, on our forecast where a well’s own record ends2020: 158 wells; starts at 972 bbl/d per well, 2,403 Mbbl cumulative through month 66 (100% of its wells old enough at that month); the dashed curve runs through month 126, on our forecast where a well’s own record ends2021: 123 wells; starts at 1,110 bbl/d per well, 2,719 Mbbl cumulative through month 54 (100% of its wells old enough at that month); the dashed curve runs through month 114, on our forecast where a well’s own record ends2022: 149 wells; starts at 1,151 bbl/d per well, 2,062 Mbbl cumulative through month 42 (100% of its wells old enough at that month); the dashed curve runs through month 52, on our forecast where a well’s own record ends2023: 157 wells; starts at 896 bbl/d per well, 1,332 Mbbl cumulative through month 30 (100% of its wells old enough at that month); the dashed curve runs through month 37, on our forecast where a well’s own record ends2024: 117 wells; starts at 981 bbl/d per well, 858 Mbbl cumulative through month 18 (100% of its wells old enough at that month); the dashed curve runs through month 28, on our forecast where a well’s own record ends2025: 128 wells; starts at 649 bbl/d per well, 242 Mbbl cumulative through month 6 (100% of its wells old enough at that month); the dashed curve runs through month 66, on our forecast where a well’s own record ends2026: 71 wells; starts at 512 bbl/d per well, 15.6 Mbbl cumulative through month 1 (100% of its wells old enough at that month); the dashed curve runs through month 61, on our forecast where a well’s own record ends20501002005001,0002,0003,000bbl/d24487296120144168192216Months on production
Petróleos Mexicanos natural gas type curves (Mcf/d per well, log scale, against months on production; cohorts 2010–2026)
Petróleos Mexicanos natural gas type curves: average thousand cubic feet per day per well on a log scale against months on production 2010-2014: 4,389 wells; starts at 454 Mcf/d per well, 1.5 Bcf cumulative through month 138 (100% of its wells old enough at that month); the dashed curve runs through month 198, on our forecast where a well’s own record ends2015: 286 wells; starts at 817 Mcf/d per well, 3.5 Bcf cumulative through month 126 (100% of its wells old enough at that month); the dashed curve runs through month 186, on our forecast where a well’s own record ends2016: 142 wells; starts at 796 Mcf/d per well, 3.2 Bcf cumulative through month 114 (100% of its wells old enough at that month); the dashed curve runs through month 174, on our forecast where a well’s own record ends2017: 62 wells; starts at 564 Mcf/d per well, 3.4 Bcf cumulative through month 102 (100% of its wells old enough at that month); the dashed curve runs through month 162, on our forecast where a well’s own record ends2018: 139 wells; starts at 428 Mcf/d per well, 2.3 Bcf cumulative through month 90 (100% of its wells old enough at that month); the dashed curve runs through month 150, on our forecast where a well’s own record ends2019: 204 wells; starts at 609 Mcf/d per well, 2.9 Bcf cumulative through month 78 (100% of its wells old enough at that month); the dashed curve runs through month 85, on our forecast where a well’s own record ends2020: 158 wells; starts at 1,182 Mcf/d per well, 4.5 Bcf cumulative through month 66 (100% of its wells old enough at that month); the dashed curve runs through month 126, on our forecast where a well’s own record ends2021: 123 wells; starts at 1,220 Mcf/d per well, 5.4 Bcf cumulative through month 54 (100% of its wells old enough at that month); the dashed curve runs through month 114, on our forecast where a well’s own record ends2022: 149 wells; starts at 2,216 Mcf/d per well, 4.5 Bcf cumulative through month 42 (100% of its wells old enough at that month); the dashed curve runs through month 52, on our forecast where a well’s own record ends2023: 157 wells; starts at 1,476 Mcf/d per well, 2.5 Bcf cumulative through month 30 (100% of its wells old enough at that month); the dashed curve runs through month 37, on our forecast where a well’s own record ends2024: 117 wells; starts at 2,332 Mcf/d per well, 2.2 Bcf cumulative through month 18 (100% of its wells old enough at that month); the dashed curve runs through month 28, on our forecast where a well’s own record ends2025: 128 wells; starts at 1,778 Mcf/d per well, 0.7 Bcf cumulative through month 6 (100% of its wells old enough at that month); the dashed curve runs through month 66, on our forecast where a well’s own record ends2026: 71 wells; starts at 1,775 Mcf/d per well, 0.1 Bcf cumulative through month 1 (100% of its wells old enough at that month); the dashed curve runs through month 61, on our forecast where a well’s own record ends701002005001,0002,0005,0007,000Mcf/d24487296120144168192216Months on production

Average production per well, for wells grouped by when they first produced.

How these curves are built

Average daily production per well, drawn against the cohort’s cumulative production per well on a log rate scale, for wells grouped by when they first produced. Includes every well of the cohort that is old enough at each month. Wells that are shut in or have stopped producing count as zero, so the average reflects the full cohort, not just survivors. Rates are calendar-day (volume ÷ days in month). The cumulative axis accumulates those same monthly averages at the average month length. Months not yet fully reported are excluded. The 2010-2014 curve draws those years as one group. The chart opens on average daily rate against months on production; the view control switches to rate against cumulative production per well (the log-rate form described above) or to cumulative production per well against months. Every view draws the same cohorts from the same production history. Each cohort is solid through the last month all of its wells sit inside fully reported data. Past it the dashed curve carries the same wells forward, on our forecast where a well’s own record ends, for up to five years. A dashed curve runs as far as at least nine in ten of its wells are accounted for. A well that is old enough but shut in still counts, as zero. The measured months are what these wells reported. In the forward months each well counts its own reported figure for each month it has one, our forecast for each month it has only that, and zero for the rest. The forward average counts every well of the cohort. The drawn forecast runs up to five years past the measured months. Line thickness tracks the size of each cohort. 5,997 wells are counted here but not shown on the age axis: they started producing in 2002 or earlier, too close to the start of our records for their region to verify their true age.

Cohort summary table
First produced Wells Peak oil (bbl/d per well) Month-12 oil (bbl/d per well) Cum oil in series (Mbbl per well) Peak gas (Mcf/d per well) Month-12 gas (Mcf/d per well) Cum gas in series (Bcf per well) Months in series Wells old enough at last month in series Forecast months drawn
2026 71 512 15.6 1,775 0.1 1 100% 60
2025 128 1,586 242 5,134 0.7 6 100% 60
2024 117 1,788 1,520 858 4,472 4,032 2.2 18 100% 10
2023 157 2,037 1,603 1,332 3,485 2,925 2.5 30 100% 7
2022 149 2,550 2,119 2,062 5,182 4,284 4.5 42 100% 10
2021 123 2,847 2,160 2,719 4,548 4,427 5.4 54 100% 60
2020 158 2,040 1,588 2,403 2,854 2,656 4.5 66 100% 60
2019 204 1,103 1,011 1,540 1,603 1,556 2.9 78 100% 7
2018 139 1,047 799 1,237 1,287 1,090 2.3 90 100% 60
2017 62 2,799 2,307 3,313 2,489 2,185 3.4 102 100% 60
2016 142 1,483 1,390 2,583 1,816 1,393 3.2 114 100% 60
2015 286 1,011 836 1,565 1,978 1,709 3.5 126 100% 60
2010-2014 4,389 407 343 622 909 791 1.5 138 100% 60

Source: CommoVision (commovision.com)

Source: CommoVision · Petróleos Mexicanos type curves, per-well production by first-production cohort.

What we cover here

Each row names the grain a region’s production is held at. Where a source publishes at a coarser grain, the page says so.

DataGrainSinceBenchmark
Mexico production field + well 1960-01

Coverage rows for Petróleos Mexicanos are regenerated at every build from the same catalog of sources the data is built from.

Top regions by 2025 operated production

RegionOil (MMbbl)Gas produced (Bcf)Share of 2025 output
Mexico5851626.5100.0%

Share of output counts oil and gas together, gas at its market-value weight.

What the data shows

  • Petróleos Mexicanos produced 585.0 MMbbl of oil and 1.63 Tcf of natural gas in 2025.
  • Petróleos Mexicanos oil production peaked in 2004 at 1.24 Bbbl; 2025 output of 585.0 MMbbl ran at 47% of that peak.
  • Petróleos Mexicanos operated production across 1 reporting region in 1 country (Mexico) in our coverage.
  • 7,018 operated producing wells tracked, trailing 12 months per region.

Get early access

Watch supply move as soon as its sources publish, with forecasts on 1.1+ million producing wells. The portal, an API and MCP access for AI tools open on October 1, 2026.

Data use is subject to our Terms of Service.