
Every producing country in the Americas
All 18 of them1: 119 published oil and gas series across 55 regions, each stated at the grain its source actually reports.
Measured by volume over calendar 2024, 81.9% of tracked oil and 93.7% of tracked gas come from series held at well grain. About 48% of the oil outside that share comes from mined projects in Canada and production facilities in Guyana, where the source reports that unit as one total.
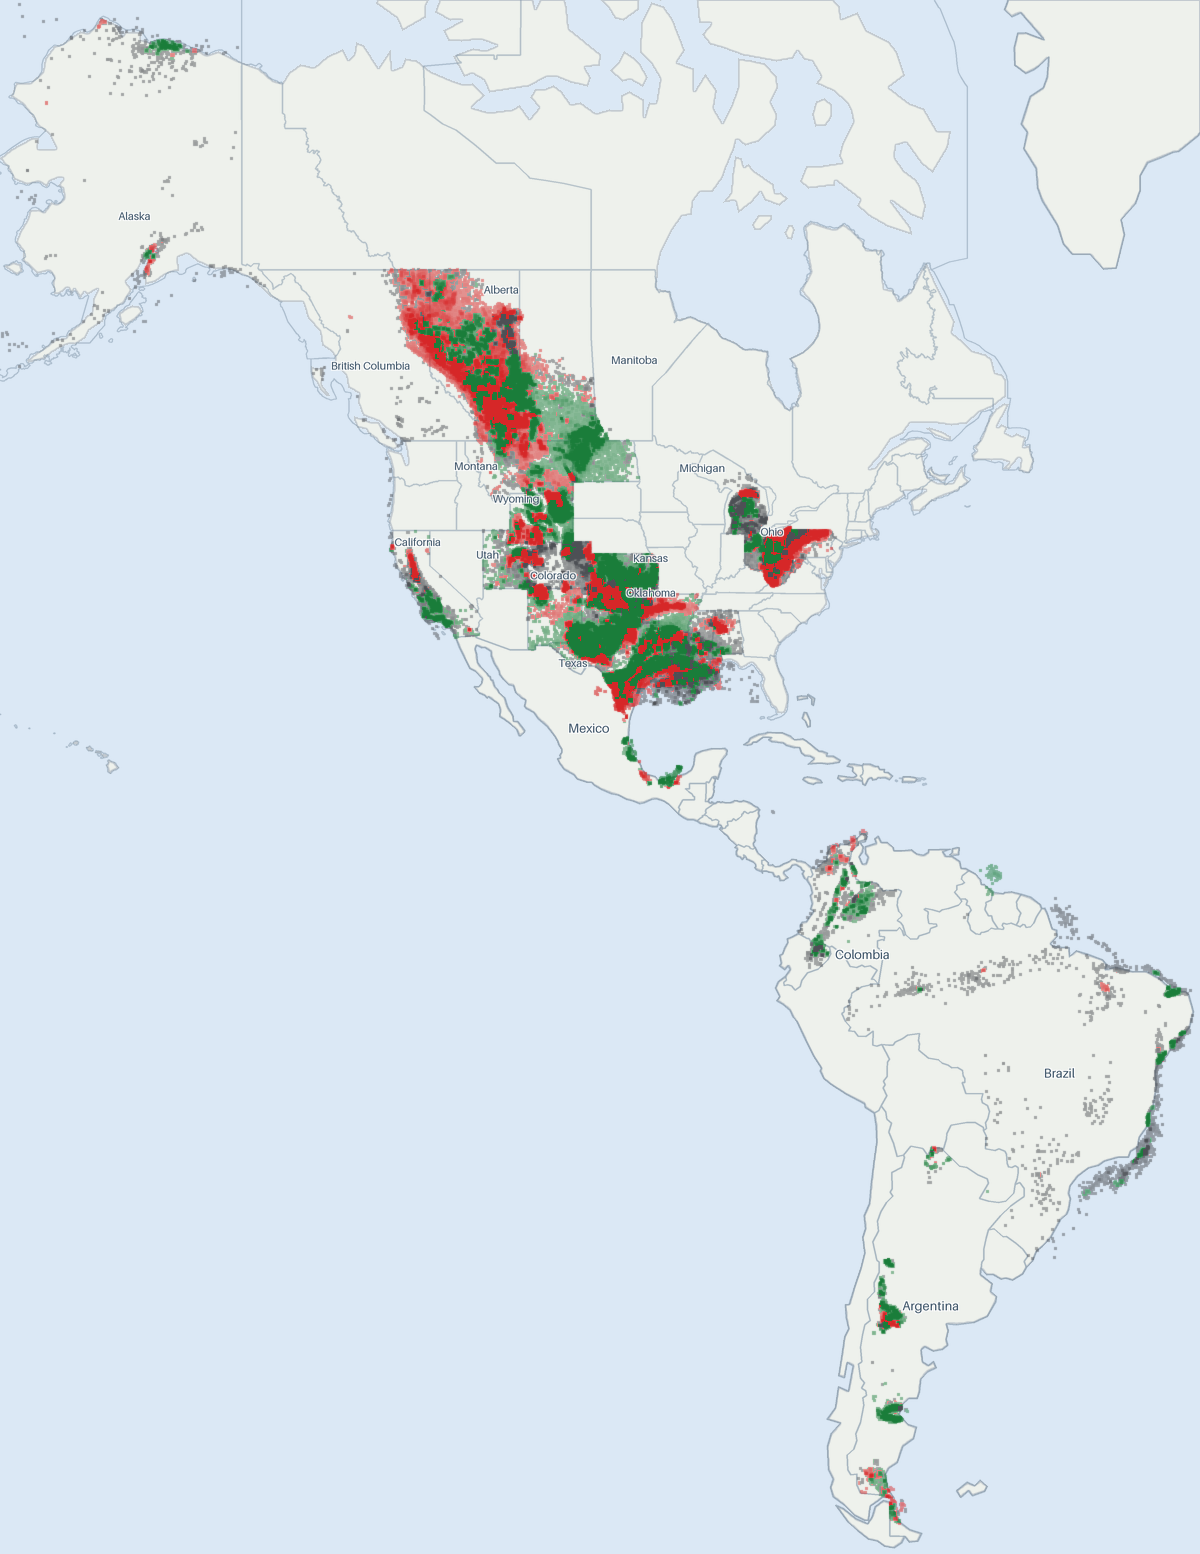
- Oil 2,185,719
- Natural gas 1,341,022
- Undetermined 716,472
Where the volume sits
Series counts say how much we publish; volume says how much of the barrel and the mcf is held at each grain. Both streams are here: the hemisphere first, then country by country.
Oil
- 81.9% Well
- 14.2% Unit: lease, block, field, facility, project, operator
- 0.1% State total
- 3.8% National total
Natural gas
- 93.7% Well
- 1.2% Unit: lease, field
- 0.3% State total
- 4.8% National total
| Country | Oil | Natural gas | ||
|---|---|---|---|---|
| Share | Grain mix within the country | Share | Grain mix within the country | |
| United States | 49.2% | 73.0% | ||
| Canada | 18.3% | 12.6% | ||
| Brazil | 12.4% | 3.2% | ||
| Mexico | 6.8% | 2.7% | ||
| Venezuela | 3.2% | 1.4% | ||
| Colombia | 2.9% | 0.8% | ||
| Argentina | 2.6% | 2.9% | ||
| Guyana | 2.3% | 0.5% | ||
| Ecuador | 1.8% | — | ||
| Trinidad and Tobago | 0.2% | 1.4% | ||
| Peru | 0.1% | 0.8% | ||
| Cuba | 0.1% | 0.1% | ||
| Bolivia | 0.1% | 0.6% | ||
| Suriname | 0.1% | <0.1% | ||
| Guatemala | <0.1% | <0.1% | ||
| Chile | <0.1% | 0.1% | ||
| Barbados | <0.1% | <0.1% | ||
| Belize | <0.1% | — | ||
Shares are of the volume we track, not of a country’s production. A country reported only at national grain is one series here and one row in the matrix below.
The matrix
Every published series, country by country. Open a country to read its regions. The United States starts open.
Grain, finest to coarsest
- well
- lease · block · field · facility · project · operator
- state total
- national total
Basis evidence
- confirmed checked against an official benchmark
- declared taken from the source’s published definitions
United States well · 42lease · 2state total · 26
| Region | Series | Grain | Data through | Basis | vs EIA |
|---|---|---|---|---|---|
| Texas | oil | well | August 2026 | gross confirmed | ~100% |
| gas | well | August 2026 | gross confirmed | ~100% | |
| New Mexico | oil | well | September 2026 | gross confirmed | ~100% |
| gas | well | September 2026 | gross confirmed | ~100% | |
| Gulf of Mexico | oil | well | June 2026 | gross confirmed | ~100% |
| gas | well | June 2026 | gross declared | ~100% | |
| North Dakota | oil | well | September 2026 | gross confirmed | ~99% |
| gas | well | September 2026 | gross confirmed | ~100% | |
| Pennsylvania | oil | well | August 2026 | gross confirmed | ~100% |
| gas | well | August 2026 | gross declared | ~100% | |
| Alaska | oil | well | August 2026 | gross confirmed | ~100% |
| gas | well | September 2026 | gross confirmed | ~101% | |
| Oklahoma | oil | well | September 2026 | gross confirmed | ~100% |
| gas | well | August 2026 | gross declared | ~99% | |
| oil | lease | September 2026 | gross confirmed | — | |
| gas | lease | August 2026 | gross declared | — | |
| Colorado | oil | well | September 2026 | gross confirmed | ~100% |
| gas | well | September 2026 | gross confirmed | ~100% | |
| Louisiana | oil | well | August 2026 | gross confirmed | ~97% |
| gas | well | August 2026 | gross confirmed | ~98% | |
| West Virginia | oil | well | March 2026 | gross confirmed | ~100% |
| gas | well | March 2026 | gross declared | ~99% | |
| Wyoming | oil | well | September 2026 | gross confirmed | ~100% |
| gas | well | September 2026 | gross confirmed | ~101% | |
| Ohio | oil | well | June 2026 | gross confirmed | ~99% |
| gas | well | June 2026 | gross declared | ~99% | |
| California | oil | well | September 2026 | gross confirmed | ~101% |
| gas | well | September 2026 | gross confirmed | ~98% | |
| Utah | oil | well | September 2026 | gross confirmed | ~100% |
| gas | well | September 2026 | gross confirmed | ~100% | |
| Kansas | oil | well | June 2026 | gross confirmed | ~99% |
| gas | well | June 2026 | gross declared | ~100% | |
| Montana | oil | well | August 2026 | gross confirmed | ~96% |
| gas | well | August 2026 | gross confirmed | ~100% | |
| Arkansas | oil | well | July 2026 | gross confirmed | ~63% |
| gas | well | July 2026 | gross declared | ~101% | |
| Mississippi | oil | well | September 2026 | gross confirmed | ~100% |
| gas | well | September 2026 | gross declared | ~102% | |
| Michigan | oil | well | August 2026 | gross confirmed | ~100% |
| gas | well | July 2026 | marketed declared | ~100% | |
| Alabama | oil | well | July 2026 | gross confirmed | ~100% |
| gas | well | July 2026 | gross declared | ~104% | |
| Illinois | oil | state total | July 2026 | gross declared | — |
| gas | state total | December 2024 gas held2 | gross declared | — | |
| Kentucky | oil | state total | July 2026 | gross declared | — |
| gas | state total | December 2024 gas held2 | gross declared | — | |
| Virginia | oil | state total | July 2026 | gross declared | — |
| gas | state total | December 2024 gas held2 | gross declared | — | |
| Pacific OCS | oil | well | June 2026 | gross confirmed | ~100% |
| gas | well | June 2026 | gross declared | — | |
| Indiana | oil | state total | July 2026 | gross declared | — |
| gas | state total | December 2024 gas held2 | gross declared | — | |
| Nebraska | oil | state total | July 2026 | gross declared | — |
| gas | state total | December 2024 gas held2 | gross declared | — | |
| Florida | oil | state total | July 2026 | gross declared | — |
| gas | state total | December 2024 gas held2 | gross declared | — | |
| South Dakota | oil | state total | July 2026 | gross declared | — |
| gas | state total | December 2024 gas held2 | gross declared | — | |
| New York | oil | state total | July 2026 | gross declared | — |
| gas | state total | December 2024 gas held2 | gross declared | — | |
| Tennessee | oil | state total | July 2026 | gross declared | — |
| gas | state total | December 2024 gas held2 | gross declared | — | |
| Nevada | oil | state total | July 2026 | gross declared | — |
| gas | state total | December 2022 gas held2 | gross declared | — | |
| Idaho | oil | state total | July 2026 | gross declared | — |
| gas | state total | December 2024 gas held2 | gross declared | — | |
| Missouri | oil | state total | July 2026 | gross declared | — |
| gas | state total | March 2014 gas held2 | gross declared | — | |
| Arizona | oil | state total | April 2026 | gross declared | — |
| gas | state total | December 2024 gas held2 | gross declared | — |
Canada well · 8field · 2project · 1
| Region | Series | Grain | Data through | Basis | vs EIA |
|---|---|---|---|---|---|
| Alberta | oil | well | August 2026 | gross confirmed | — |
| gas | well | August 2026 | gross declared | — | |
| oil | project | May 2026 | gross confirmed | — | |
| British Columbia | oil | well | August 2026 | gross confirmed | — |
| gas | well | August 2026 | gross declared | — | |
| Saskatchewan | oil | well | August 2026 | gross confirmed | — |
| gas | well | August 2026 | gross declared | — | |
| Newfoundland & Labrador Offshore | oil | field | August 2026 | gross declared | — |
| gas | field | August 2026 | gross declared | — | |
| Manitoba | oil | well | August 2026 | gross confirmed | — |
| gas | well | August 2026 | gross declared | — |
Brazil well · 2
| Region | Series | Grain | Data through | Basis | vs EIA |
|---|---|---|---|---|---|
| Brazil | oil | well | August 2026 | gross declared | — |
| gas | well | August 2026 | gross declared | — |
Mexico well · 2field · 2
| Region | Series | Grain | Data through | Basis | vs EIA |
|---|---|---|---|---|---|
| Mexico | oil | well | July 2026 | gross declared | — |
| gas | well | July 2026 | gross declared | — | |
| oil | field | December 1999 | gross declared | — | |
| gas | field | December 1999 | gross declared | — |
Argentina well · 2
| Region | Series | Grain | Data through | Basis | vs EIA |
|---|---|---|---|---|---|
| Argentina | oil | well | September 2026 | gross declared | — |
| gas | well | September 2026 | gross declared | — |
Venezuela national total · 2
Colombia field · 2
| Region | Series | Grain | Data through | Basis | vs EIA |
|---|---|---|---|---|---|
| Colombia | oil | field | August 2026 | gross declared | — |
| gas | field | August 2026 | gross declared | — |
Guyana facility · 1national total · 1
| Region | Series | Grain | Data through | Basis | vs EIA |
|---|---|---|---|---|---|
| Guyana | oil | facility | August 2026 | gross declared | — |
| gas | national total | August 2026 | gross declared | — |
Ecuador block · 2field · 2operator · 2
| Region | Series | Grain | Data through | Basis | vs EIA |
|---|---|---|---|---|---|
| Ecuador | oil | block | September 2026 | gross declared | — |
| gas | block | December 2021 | gross declared | — | |
| oil | field | August 2026 | gross declared | — | |
| gas | field | December 2021 | gross declared | — | |
| oil | operator | September 2026 | gross declared | — | |
| gas | operator | December 2021 | gross declared | — |
Trinidad and Tobago national total · 2
| Region | Series | Grain | Data through | Basis | vs EIA |
|---|---|---|---|---|---|
| Trinidad and Tobago | oil | national total | May 2026 | gross declared | — |
| gas | national total | 2024 annual gas held2 | dry gas declared | — |
Peru national total · 2
Bolivia national total · 2
Cuba national total · 2
Suriname national total · 2
Chile national total · 2
Guatemala national total · 2
Barbados national total · 2
Belize national total · 2
Oil and gas series. Produced water is tracked for some regions and joins this table when its registry rows are complete.
How our totals compare with the EIA
The EIA estimates each state’s production from an operator survey. It publishes about two months after the production month. The series compared here are rebuilt from the source’s own records as they arrive. The two agree closely for the United States as a whole. The most recent months differ while filings are still arriving. The methodology page explains why.
- CommoVision
- EIA
Interactive chart. Focus it and use the left and right arrow keys to read each month, Page Up and Page Down for a year at a time, Home and End for the ends of the series. The full figures are also in the table on this page.
All from what the source published. 99.73% held at well grain.
How the volume breaks down
- 76.5% Reported by the official source by well
- 0.27% Reported by the official source as a lease, facility, field or state total. Published without per-well detail.
- 22.3% Reported by the official source as a lease total, split across the lease's wells. The regional total shown is the reported number, to rounding.
- 0.87% Reported by the official source for a longer period, spread across its months. The period total is the reported number.
- under 0.01% A series adjusted to match figures the official source published: a well's cumulative, a later correction netted into the months before it, or a field's oil volume from the royalty file for a month missing from the production report.
- under 0.01% Filed with the official source, which withheld this period's production figure for one stream. That stream carries a placeholder zero.
Every barrel in the chart starts from what the official source published for the months measured. Measured over April 2023 to March 2026.
- Our United States oil total across the regions compared here is 0.1% above the EIA series over April 2023 to March 2026. The regions we publish account for 99.7% of the EIA’s whole United States oil series over the same months.
- The months January 2026 to March 2026 are still filling in for Michigan, Ohio, Pennsylvania and West Virginia. At least 80.0% of the volume we expect in each has landed.
- The oil chart covers the regions with comparable months across the whole window. California has comparable months through December 2025.
- CommoVision
- EIA
Interactive chart. Focus it and use the left and right arrow keys to read each month, Page Up and Page Down for a year at a time, Home and End for the ends of the series. The full figures are also in the table on this page.
All from what the source published. 99.83% held at well grain.
How the volume breaks down
- 83.4% Reported by the official source by well
- 0.17% Reported by the official source as a lease, facility, field or state total. Published without per-well detail.
- 11.6% Reported by the official source as a lease total, split across the lease's wells. The regional total shown is the reported number, to rounding.
- 4.8% Reported by the official source for a longer period, spread across its months. The period total is the reported number.
- under 0.01% A series adjusted to match figures the official source published: a well's cumulative, a later correction netted into the months before it, or a field's oil volume from the royalty file for a month missing from the production report.
- 0.01% Published by the official source as its own estimate rather than an operator-attested figure
- 0.08% The official source filed this volume for its reporting unit without naming the well. The well shown is our attribution, made only where a measured one-well ground identifies it; the volume itself is the source's own figure, untouched.
Every cubic foot in the chart starts from what the official source published for the months measured. Measured over April 2023 to March 2026.
- Our United States natural gas total across the regions compared here is 0.3% below the EIA series over April 2023 to March 2026. The regions we publish account for 99.8% of the EIA’s whole United States natural gas series over the same months.
- The months January 2026 to March 2026 are still filling in for Ohio, Pennsylvania and West Virginia. At least 92.7% of the volume we expect in each has landed.
- The natural gas chart covers the regions with comparable months across the whole window. Alabama, Michigan and Mississippi have comparable months through December 2024, and Pacific OCS has no comparable EIA series.
Region by region
Each figure is our total as a multiple of the EIA series over that region’s last 36 months. The last 12 of those months sit beside it. A region more than 5% from the EIA series either way carries a note. Where a region’s comparable months end earlier than the rest, its cell names the month it runs through. Where a region has months still filling in, its cell says how many.
| Region | Oil, 36 months | last 12 | Gas, 36 months | last 12 | Note |
|---|---|---|---|---|---|
| Alaska | 1.000 | 1.000 | 1.006 | 1.006 | |
| Alabama | 1.011 | 1.039 | 1.044through December 2024 | 1.065 | |
| Arkansas | 0.6191 month filling in | 0.612 | 1.023 | 1.035 | Where we have checked, the underlying filings match the official source’s own records. The natural gas built from those same filings agrees with the EIA series. Oil filed on wells we class as service or disposal is not counted as production here, and that is part of the difference. The rest is not traced to a cause. |
| California | 1.003through December 2025 | 1.002 | 0.9731 month filling in | 0.987 | |
| Colorado | 1.004 | 1.006 | 1.009 | 1.003 | |
| Gulf of Mexico | 1.003 | 1.008 | 1.021 | 1.040 | |
| Kansas | 0.994 | 0.996 | 0.991 | 0.974 | |
| Louisiana | 0.977 | 0.987 | 0.975 | 0.970 | |
| Michigan | 1.0045 months filling in | 1.018 | 1.001through December 2024 | 1.000 | |
| Mississippi | 1.001 | 1.004 | 1.040through December 2024 | 1.062 | |
| Montana | 0.973 | 0.962 | 0.9981 month filling in | 1.000 | |
| North Dakota | 0.998 | 0.999 | 0.997 | 0.992 | |
| New Mexico | 0.995 | 0.987 | 0.988 | 0.982 | |
| Ohio | 0.9896 months filling in | 0.984 | 0.9976 months filling in | 0.997 | |
| Oklahoma | 1.007 | 1.006 | 0.952 | 0.939 | |
| Pennsylvania | 0.9437 months filling in | 0.846 | 1.0117 months filling in | 1.010 | Pennsylvania’s oil and natural gas figures are built from the same operator filings. The natural gas agrees with the EIA series. Part of the state’s oil arrives on annual and other period reports, which we spread across the months they cover, so recent months read low until those filings arrive. |
| Pacific OCS | 1.000 | 1.000 | — | — | |
| Texas | 1.001 | 0.995 | 1.003 | 1.002 | |
| Utah | 0.993 | 0.981 | 0.984 | 0.980 | |
| West Virginia | 1.0013 months filling in | 0.987 | 0.9683 months filling in | 0.955 | |
| Wyoming | 0.997 | 0.990 | 1.048 | 1.096 |
A dash means no comparable EIA series for that region and stream. The figures are our published totals, every origin included. The provenance line under each chart says what that means. The vs EIA column in the matrix above is the same comparison taken over complete calendar years.
How to read this table
- Grain
- The unit a series is held at: an individual well, a lease, a block, a field, a facility, a mined project, an operator group, a state total, or a national total. Where that unit is coarser than a well, the source publishes no per-well volume for it.
- Basis
- Where a volume sits on the wellhead-to-market waterfall. Gross includes flared, vented, re-injected and fuel gas; marketed sits below those; dry gas is consumer-grade gas after liquids extraction, below marketed. The wedge between these is almost entirely a gas story; for oil the differences are small.
- Confirmed and declared
- Confirmed means the stated basis has been checked against an official benchmark series: EIA for US regions, CER and Statistics Canada for Canadian provinces. Where the national series itself republishes our source, that check is a consistency check rather than an independent benchmark. Declared means the stated basis comes from the source’s published definitions and filing rules: a strong prior, and stated as that rather than as a check. 82 of 119 series carry a declared basis today, across 45 regions. The methodology page explains how the EIA produces its estimates, and why recent months can differ from ours.
- vs EIA
- Our published total for a US region as a share of the matching EIA series, recomputed with each data snapshot. It is a comparison that is tracked, never a pass mark. Canadian provinces are checked against CER and Statistics Canada instead; that check lives in the confirmed marker. For the 10 countries filled from the EIA’s international series, and for the US state totals filled from EIA state data, the EIA is the source itself, so a comparison against it would check nothing; those cells stay empty. A US region can also lack the metric for one stream while carrying it for the other; that cell is empty too.
- Data through
- The latest month a series holds a figure for, complete or still filling in. A region page’s own attribution names the last complete month and says which later months are still filling in, so the two can differ by a month or two.
- Regions at more than one grain
- Where a US region publishes at more than one grain, the EIA share covers the region’s combined published total and appears once, on its well row.
Notes
- The census behind “every producing country” adjudicates 36 non-producing places individually, and Paraguay is its one qualified zero. Its official source states that the country imports all of the hydrocarbons it consumes. The caveat on record: a single Chaco well reported a micro-scale gas flow in 2016, supplying one local generator, under a concession still in the exploitation stage. Whether it flows today is unverified, so Paraguay is carried as this footnote rather than rounded away.
- The production charts on this site hold back the natural gas of 10 countries and 13 US state totals: the rows marked here. Their gas figures stopped arriving after December 2024 at the latest; each marked row’s own Data through month states where its series ends. The charts hold every month of that gas back, while their oil stays in. The table states the coverage those gas series reach; they return to the charts when the feed is repaired.
- Oil for the EIA-filled countries is crude oil including lease condensate, the series’ own definition. Their natural gas is a dry-gas series, annual, carried as the source publishes it.
See it applied
The data pages put this coverage to work, and the methodology explains how the numbers are built and revised. For a question about a specific series, get in touch.
Source: CommoVision. Each series above states its own data-through month; the freshest runs to September 2026.
Data use is subject to our Terms of Service.