CommoVision

See the future in real time

Tuscaloosa County, Alabama

Tuscaloosa County, Alabama produced 103 bbl of oil and 23.4 Bcf of natural gas in 2025. 3,696 producing wells tracked, 12 months to Jun 2026.

  • Largest gas-producing county in Alabama, 2025.
  • 30.6% of the natural gas produced in Alabama, 2025.
  • Natural gas production fell 4% in 2025 from 2024.
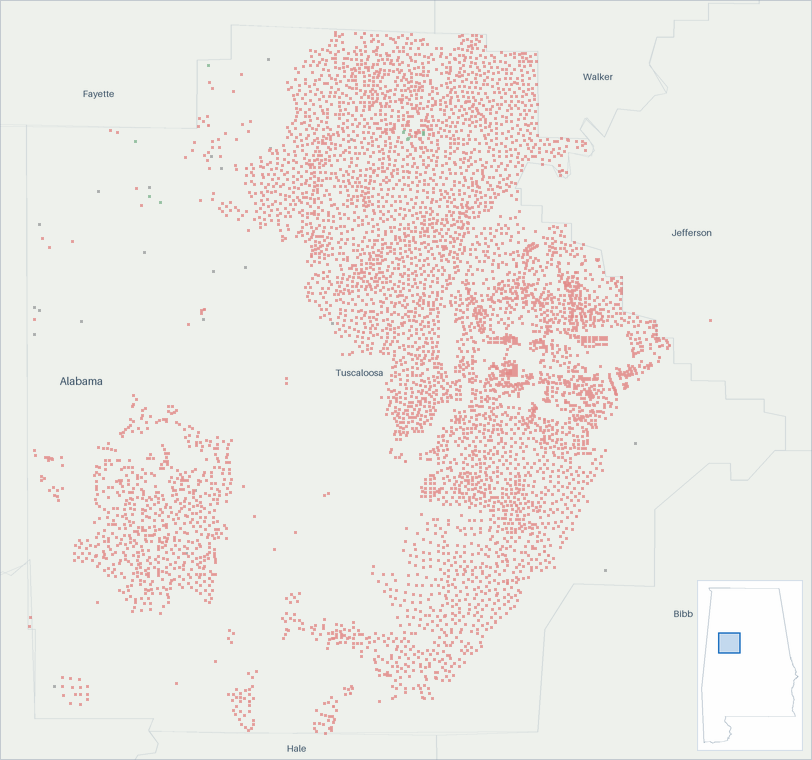
Well map of Tuscaloosa County, Alabama. The full map is further down this page.

Production

Tuscaloosa County, Alabama natural gas production (MMcf/d, grouped by when each well first produced)
  • filling in (est. · missed) . Hatching marks our estimate of the volume still to be filed. That estimate draws on our own production forecast. A check on the forecast behind this estimate measured a miss. It updates as filings arrive
  • estimated . Hatching marks our estimate. In the most recent months that is volume still to be filed. Past the divider it is our estimate of each whole month, built on any filings already in. Beyond the last filings it is our forecast.
Tuscaloosa County, Alabama natural gas production: million cubic feet per day, by first-production vintage filed in full 50100150 MMcf/d 2017201820192020202120222023202420252026 Oct 2016: 125 MMcf/d total Nov 2016: 124 MMcf/d total Dec 2016: 123 MMcf/d total Jan 2017: 119 MMcf/d total Feb 2017: 118 MMcf/d total Mar 2017: 117 MMcf/d total Apr 2017: 117 MMcf/d total May 2017: 116 MMcf/d total Jun 2017: 116 MMcf/d total Jul 2017: 115 MMcf/d total Aug 2017: 114 MMcf/d total Sep 2017: 113 MMcf/d total Oct 2017: 113 MMcf/d total Nov 2017: 111 MMcf/d total Dec 2017: 110 MMcf/d total Jan 2018: 101 MMcf/d total Feb 2018: 103 MMcf/d total Mar 2018: 104 MMcf/d total Apr 2018: 104 MMcf/d total May 2018: 104 MMcf/d total Jun 2018: 103 MMcf/d total Jul 2018: 103 MMcf/d total Aug 2018: 103 MMcf/d total Sep 2018: 103 MMcf/d total Oct 2018: 103 MMcf/d total Nov 2018: 102 MMcf/d total Dec 2018: 98 MMcf/d total Jan 2019: 96.2 MMcf/d total Feb 2019: 95.9 MMcf/d total Mar 2019: 95.9 MMcf/d total Apr 2019: 95.9 MMcf/d total May 2019: 96.6 MMcf/d total Jun 2019: 96.7 MMcf/d total Jul 2019: 96.3 MMcf/d total Aug 2019: 95 MMcf/d total Sep 2019: 94 MMcf/d total Oct 2019: 94.3 MMcf/d total Nov 2019: 93.7 MMcf/d total Dec 2019: 92.1 MMcf/d total Jan 2020: 89.3 MMcf/d total Feb 2020: 89.5 MMcf/d total Mar 2020: 88.6 MMcf/d total Apr 2020: 88.6 MMcf/d total May 2020: 89 MMcf/d total Jun 2020: 88.2 MMcf/d total Jul 2020: 87.3 MMcf/d total Aug 2020: 85 MMcf/d total Sep 2020: 86.9 MMcf/d total Oct 2020: 87.2 MMcf/d total Nov 2020: 88.3 MMcf/d total Dec 2020: 86.2 MMcf/d total Jan 2021: 84.7 MMcf/d total Feb 2021: 83.4 MMcf/d total Mar 2021: 82.7 MMcf/d total Apr 2021: 80.5 MMcf/d total May 2021: 78.6 MMcf/d total Jun 2021: 80.1 MMcf/d total Jul 2021: 80.8 MMcf/d total Aug 2021: 80.6 MMcf/d total Sep 2021: 80.3 MMcf/d total Oct 2021: 80 MMcf/d total Nov 2021: 80.9 MMcf/d total Dec 2021: 79.3 MMcf/d total Jan 2022: 77.4 MMcf/d total Feb 2022: 74.8 MMcf/d total Mar 2022: 73.9 MMcf/d total Apr 2022: 73.4 MMcf/d total May 2022: 75.4 MMcf/d total Jun 2022: 75 MMcf/d total Jul 2022: 74.2 MMcf/d total Aug 2022: 74 MMcf/d total Sep 2022: 73.1 MMcf/d total Oct 2022: 75.6 MMcf/d total Nov 2022: 76.8 MMcf/d total Dec 2022: 72.8 MMcf/d total Jan 2023: 71.8 MMcf/d total Feb 2023: 70.9 MMcf/d total Mar 2023: 70.9 MMcf/d total Apr 2023: 71.7 MMcf/d total May 2023: 71.5 MMcf/d total Jun 2023: 71 MMcf/d total Jul 2023: 70.6 MMcf/d total Aug 2023: 68.9 MMcf/d total Sep 2023: 70.4 MMcf/d total Oct 2023: 71.3 MMcf/d total Nov 2023: 72.2 MMcf/d total Dec 2023: 70.5 MMcf/d total Jan 2024: 66.4 MMcf/d total Feb 2024: 67.4 MMcf/d total Mar 2024: 66.2 MMcf/d total Apr 2024: 67.4 MMcf/d total May 2024: 66.8 MMcf/d total Jun 2024: 63.9 MMcf/d total Jul 2024: 66.2 MMcf/d total Aug 2024: 64 MMcf/d total Sep 2024: 66.2 MMcf/d total Oct 2024: 68.6 MMcf/d total Nov 2024: 69.7 MMcf/d total Dec 2024: 67.4 MMcf/d total Jan 2025: 63.6 MMcf/d total Feb 2025: 61.5 MMcf/d total Mar 2025: 64.8 MMcf/d total Apr 2025: 65.2 MMcf/d total May 2025: 64.8 MMcf/d total Jun 2025: 61.9 MMcf/d total Jul 2025: 62.9 MMcf/d total Aug 2025: 64.1 MMcf/d total Sep 2025: 63.9 MMcf/d total Oct 2025: 66.1 MMcf/d total Nov 2025: 66.1 MMcf/d total Dec 2025: 63.3 MMcf/d total Jan 2026: 61.6 MMcf/d total Feb 2026: 62 MMcf/d total Mar 2026: 62 MMcf/d total Apr 2026: 62 MMcf/d total May 2026: ≈63.1 MMcf/d total (99% arrived, remainder estimated) Jun 2026: ≈60.6 MMcf/d total (99% arrived, remainder estimated) Jul 2026: ≈63.1 MMcf/d total (<1% arrived, remainder estimated) Aug 2026: ≈63.2 MMcf/d total (<1% arrived, remainder estimated) Sep 2026: ≈63.3 MMcf/d total (<1% arrived, remainder estimated)

In this view, hatching marks our estimate, and in the most recent months that is volume still to be filed. Past the divider, the chart continues only the bands it has drawn. Each band continues as our estimate, from any filings already in and then from our forecast, built by summing our per-well forecasts. The method behind each well is recorded with the forecast. The forward months cover existing wells only. How our methods work

All from what the source published. All held at well grain.

How the volume breaks down
  • 100% Reported by the official source by well

Every cubic foot through April 2026 starts from what the official source published for those months. Measured over January 1982 to April 2026.

Tuscaloosa County, Alabama oil production (bbl/d, grouped by when each well first produced)
  • filling in (est.) . Hatching marks our estimate of the volume still to be filed. It updates as filings arrive
Tuscaloosa County, Alabama oil production: barrels per day, by first-production vintage today 0.20.40.6 bbl/d 2017201820192020202120222023202420252026 Jun 2016: 0 bbl/d total Jul 2016: 0 bbl/d total Aug 2016: 0 bbl/d total Sep 2016: 0 bbl/d total Oct 2016: 0 bbl/d total Nov 2016: 0.03 bbl/d total Dec 2016: 0.03 bbl/d total Jan 2017: 0.19 bbl/d total Feb 2017: 0.07 bbl/d total Mar 2017: 0 bbl/d total Apr 2017: 0.03 bbl/d total May 2017: 0 bbl/d total Jun 2017: 0 bbl/d total Jul 2017: 0 bbl/d total Aug 2017: 0.03 bbl/d total Sep 2017: 0 bbl/d total Oct 2017: 0.03 bbl/d total Nov 2017: 0.03 bbl/d total Dec 2017: 0.16 bbl/d total Jan 2018: 0.1 bbl/d total Feb 2018: 0 bbl/d total Mar 2018: 0.19 bbl/d total Apr 2018: 0.03 bbl/d total May 2018: 0.03 bbl/d total Jun 2018: 0 bbl/d total Jul 2018: 0 bbl/d total Aug 2018: 0 bbl/d total Sep 2018: 0 bbl/d total Oct 2018: 0 bbl/d total Nov 2018: 0 bbl/d total Dec 2018: 0 bbl/d total Jan 2019: 0.39 bbl/d total Feb 2019: 0.07 bbl/d total Mar 2019: 0.07 bbl/d total Apr 2019: 0 bbl/d total May 2019: 0.03 bbl/d total Jun 2019: 0 bbl/d total Jul 2019: 0.03 bbl/d total Aug 2019: 0 bbl/d total Sep 2019: 0 bbl/d total Oct 2019: 0 bbl/d total Nov 2019: 0 bbl/d total Dec 2019: 0 bbl/d total Jan 2020: 0 bbl/d total Feb 2020: 0 bbl/d total Mar 2020: 0 bbl/d total Apr 2020: 0 bbl/d total May 2020: 0.03 bbl/d total Jun 2020: 0 bbl/d total Jul 2020: 0.07 bbl/d total Aug 2020: 0 bbl/d total Sep 2020: 0 bbl/d total Oct 2020: 0 bbl/d total Nov 2020: 0 bbl/d total Dec 2020: 0 bbl/d total Jan 2021: 0 bbl/d total Feb 2021: 0 bbl/d total Mar 2021: 0 bbl/d total Apr 2021: 0 bbl/d total May 2021: 0 bbl/d total Jun 2021: 0 bbl/d total Jul 2021: 0 bbl/d total Aug 2021: 0 bbl/d total Sep 2021: 0 bbl/d total Oct 2021: 0 bbl/d total Nov 2021: 0 bbl/d total Dec 2021: 0 bbl/d total Jan 2022: 0 bbl/d total Feb 2022: 0 bbl/d total Mar 2022: 0 bbl/d total Apr 2022: 0 bbl/d total May 2022: 0 bbl/d total Jun 2022: 0 bbl/d total Jul 2022: 0 bbl/d total Aug 2022: 0.19 bbl/d total Sep 2022: 0 bbl/d total Oct 2022: 0 bbl/d total Nov 2022: 0 bbl/d total Dec 2022: 0 bbl/d total Jan 2023: 0 bbl/d total Feb 2023: 0 bbl/d total Mar 2023: 0 bbl/d total Apr 2023: 0 bbl/d total May 2023: 0 bbl/d total Jun 2023: 0 bbl/d total Jul 2023: 0 bbl/d total Aug 2023: 0 bbl/d total Sep 2023: 0 bbl/d total Oct 2023: 0 bbl/d total Nov 2023: 0 bbl/d total Dec 2023: 0 bbl/d total Jan 2024: 0 bbl/d total Feb 2024: 0 bbl/d total Mar 2024: 0.39 bbl/d total Apr 2024: 0 bbl/d total May 2024: 0 bbl/d total Jun 2024: 0 bbl/d total Jul 2024: 0 bbl/d total Aug 2024: 0 bbl/d total Sep 2024: 0.23 bbl/d total Oct 2024: 0.23 bbl/d total Nov 2024: 0.2 bbl/d total Dec 2024: 0.42 bbl/d total Jan 2025: 0.48 bbl/d total Feb 2025: 0.39 bbl/d total Mar 2025: 0.26 bbl/d total Apr 2025: 0.27 bbl/d total May 2025: 0.26 bbl/d total Jun 2025: 0.27 bbl/d total Jul 2025: 0.26 bbl/d total Aug 2025: 0.26 bbl/d total Sep 2025: 0.27 bbl/d total Oct 2025: 0.26 bbl/d total Nov 2025: 0.43 bbl/d total Dec 2025: 0 bbl/d total Jan 2026: 0.13 bbl/d total Feb 2026: 0.18 bbl/d total Mar 2026: 0.16 bbl/d total Apr 2026: 0.17 bbl/d total May 2026: ≈0.13 bbl/d total (99% arrived, remainder estimated)

Still arriving: Jun 2026 99% filed, Jul 2026 <1% filed, Aug 2026 <1% filed.

The most recent months are still filling in. The chart updates as filings arrive.

All from what the source published. All held at well grain.

How the volume breaks down
  • 100% Reported by the official source by well

Every barrel through April 2026 starts from what the official source published for those months. Measured over January 1982 to April 2026.

The bands group wells by when they first produced.

About this chart

The stack shows what is holding today's rate up and how much of it is new drilling. In the reported months the bands draw the filings already in. The months still filling in are marked.

Annual table (full history)
YearOil (MMbbl)Gas produced (Bcf)
2025<0.123
2024<0.124
20230.026
2022<0.127
20210.030
2020<0.132
2019<0.135
2018<0.137
2017<0.142
2016<0.146
2015<0.151
2014<0.154
2013<0.159
2012<0.163
2011<0.167
20100.073
20090.078
2008<0.181
2007<0.184
2006<0.187
2005<0.190
20040.098
20030.0102
20020.0102
20010.0101
20000.099
1999<0.1101
1998<0.1103
19970.0100
19960.099
19950.098
19940.098
19930.094
19920.079
1991<0.155
1990<0.126
1989<0.116
1988<0.115
1987<0.114
1986<0.112
1985<0.18
1984<0.16
1983<0.13
19820.01

Source: CommoVision (commovision.com)

Monthly table (last 24 months)
MonthOil (Mbbl)Gas produced (MMcf)
2026-060.01,796
2026-05<0.11,936
2026-04<0.11,853
2026-03<0.11,921
2026-02<0.11,736
2026-01<0.11,908
2025-120.01,961
2025-11<0.11,983
2025-10<0.12,050
2025-09<0.11,918
2025-08<0.11,986
2025-07<0.11,949
2025-06<0.11,857
2025-05<0.12,009
2025-04<0.11,956
2025-03<0.12,008
2025-02<0.11,723
2025-01<0.11,973
2024-12<0.12,089
2024-11<0.12,092
2024-10<0.12,127
2024-09<0.11,987
2024-080.01,984
2024-070.02,051

Source: CommoVision (commovision.com)

Source: CommoVision · Tuscaloosa County, Alabama, data through June 2026.

Well map

A map of 5,677 well locations in Tuscaloosa County, Alabama for which CommoVision holds a published surface coordinate, each drawn where it is and colored by its primary product (green for oil, red for natural gas, gray where undetermined; a spot shared by more than one product shows the one with the most wells there), on a ground of land and water over faint county outlines and place names for orientation, with a small inset map locating this frame in Alabama.
  • Oil 7
  • Natural gas 5,638
  • Undetermined 32
5,677 well locations in Tuscaloosa County, Alabama, colored by primary product.
About this map

Undetermined means not enough signal to settle it. Producing wells are the ones that reported oil or gas in the 12 months to Jun 2026.

0.1 bbl/d May 2026 oil production -50% vs May last year
60.6 MMcf/d (est.) Jun 2026 gas production Jun 2026 is still filling in. The figure is the filings already in plus an estimate of the part not yet filed. The change compares this estimate with the same month last year. -2% vs Jun last year
0.3 bbl/d 2025 oil production
64 MMcf/d 2025 gas production
3,696 wells Producing wells tracked 12 months to Jun 2026
55.9 MMcf/d Existing wells, Sep 2027 forecast Our forecast for existing wells.

Top operators in Tuscaloosa County, Alabama, 2025

  1. Warrior Met Coal Gas, LLC 35.5%
  2. PGP Operating, LLC 33.2%
  3. Urban Oil & Gas Group 30.4%
  4. O.G.P. Operating 0.8%
  5. Jabsco Oil Operating, LLC 0.1%
Top operators in Tuscaloosa County, Alabama, 2025: full table
OperatorOil (Mbbl/d, 2025)Gas produced (MMcf/d, 2025)Share of output
Warrior Met Coal Gas, LLC 0.022.735.5%
PGP Operating, LLC 0.021.233.2%
Urban Oil & Gas Group 0.019.530.4%
O.G.P. Operating 0.00.50.8%
Jabsco Oil Operating, LLC 0.00.10.1%

Mbbl/d = thousand barrels per day · MMcf/d = million cubic feet per day (units).

Source: CommoVision (commovision.com)

What we cover here

Each row names the grain a region’s production is held at. Where a source publishes at a coarser grain, the page says so.

DataGrainSinceBenchmark
Alabama production well 1944-04 ~99–104% of EIA

Benchmark cells compare our series with the EIA’s published estimates.

About the EIA comparison

The two are produced differently: the EIA estimates from a survey of the largest operators and a model built to anticipate late filings, while the series compared here are rebuilt from the source’s own records as they arrive. Recent months can differ without either being wrong; the methodology page explains both methods.

Coverage rows for Tuscaloosa County, Alabama are regenerated at every build from the same catalog of sources the data is built from.

What the data shows

  • Tuscaloosa County, Alabama produced 103 bbl of oil and 23.4 Bcf of natural gas in 2025.
  • Tuscaloosa County, Alabama gas production peaked in 1998 at 103.2 Bcf; 2025 output of 23.4 Bcf ran at 23% of that peak.
  • 3,696 producing wells tracked, 12 months to Jun 2026.

Get early access

Watch supply move as soon as its sources publish, with forecasts on 1.1+ million producing wells. The portal, an API and MCP access for AI tools open on October 1, 2026.

Data use is subject to our Terms of Service.