CommoVision

See the future in real time

Sandoval County, New Mexico

Sandoval County, New Mexico produced 2.3 MMbbl of oil and 9.2 Bcf of natural gas in 2025. 386 producing wells tracked, 12 months to Aug 2026.

  • Fourth-largest oil-producing county in New Mexico, 2025.
  • 0.3% of the oil produced in New Mexico, 2025.
  • Oil production fell 2% in 2025 from 2024.
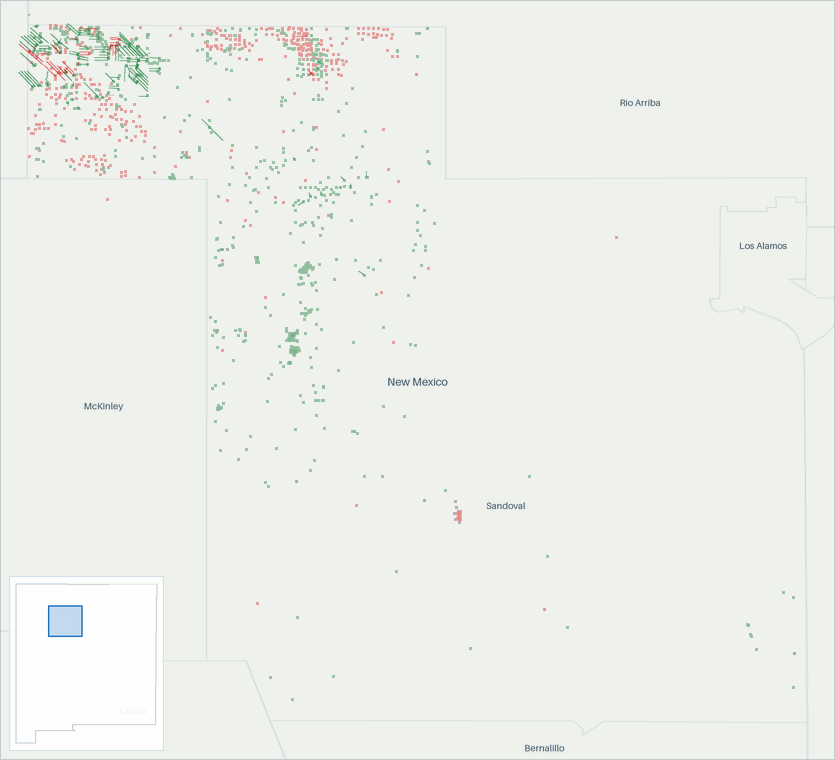
Well map of Sandoval County, New Mexico. The full map is further down this page.

Production

Sandoval County, New Mexico oil production (Mbbl/d, grouped by when each well first produced)
  • filling in (est. · provisional) . Hatching marks our estimate of the volume still to be filed. That estimate draws on our own production forecast. This estimate is published as our best figure. No miss stands against it. It updates as filings arrive
  • estimated . Hatching marks our estimate. In the most recent months that is volume still to be filed. Past the divider it is our estimate of each whole month, built on any filings already in. Beyond the last filings it is our forecast.
Sandoval County, New Mexico oil production: thousand barrels per day, by first-production vintage filed in full 51015 Mbbl/d 2017201820192020202120222023202420252026 Dec 2016: 3.41 Mbbl/d total Jan 2017: 3.22 Mbbl/d total Feb 2017: 3.1 Mbbl/d total Mar 2017: 3.05 Mbbl/d total Apr 2017: 3.01 Mbbl/d total May 2017: 2.98 Mbbl/d total Jun 2017: 5 Mbbl/d total Jul 2017: 4.16 Mbbl/d total Aug 2017: 3.57 Mbbl/d total Sep 2017: 4.96 Mbbl/d total Oct 2017: 4.41 Mbbl/d total Nov 2017: 3.79 Mbbl/d total Dec 2017: 3.57 Mbbl/d total Jan 2018: 3.31 Mbbl/d total Feb 2018: 2.94 Mbbl/d total Mar 2018: 4.41 Mbbl/d total Apr 2018: 3.67 Mbbl/d total May 2018: 3.5 Mbbl/d total Jun 2018: 3.58 Mbbl/d total Jul 2018: 3.11 Mbbl/d total Aug 2018: 3.19 Mbbl/d total Sep 2018: 2.99 Mbbl/d total Oct 2018: 2.91 Mbbl/d total Nov 2018: 4.12 Mbbl/d total Dec 2018: 3.95 Mbbl/d total Jan 2019: 3.54 Mbbl/d total Feb 2019: 4.09 Mbbl/d total Mar 2019: 4.42 Mbbl/d total Apr 2019: 4.76 Mbbl/d total May 2019: 5.29 Mbbl/d total Jun 2019: 5.42 Mbbl/d total Jul 2019: 5.3 Mbbl/d total Aug 2019: 6.08 Mbbl/d total Sep 2019: 6.03 Mbbl/d total Oct 2019: 5.83 Mbbl/d total Nov 2019: 9.28 Mbbl/d total Dec 2019: 9.12 Mbbl/d total Jan 2020: 8.23 Mbbl/d total Feb 2020: 7.84 Mbbl/d total Mar 2020: 7.63 Mbbl/d total Apr 2020: 6.06 Mbbl/d total May 2020: 2.79 Mbbl/d total Jun 2020: 6.67 Mbbl/d total Jul 2020: 6.08 Mbbl/d total Aug 2020: 5.73 Mbbl/d total Sep 2020: 5.3 Mbbl/d total Oct 2020: 5.02 Mbbl/d total Nov 2020: 4.91 Mbbl/d total Dec 2020: 5.83 Mbbl/d total Jan 2021: 6.57 Mbbl/d total Feb 2021: 6.97 Mbbl/d total Mar 2021: 6.22 Mbbl/d total Apr 2021: 4.17 Mbbl/d total May 2021: 7.78 Mbbl/d total Jun 2021: 8.42 Mbbl/d total Jul 2021: 7.94 Mbbl/d total Aug 2021: 7.49 Mbbl/d total Sep 2021: 6.5 Mbbl/d total Oct 2021: 5.93 Mbbl/d total Nov 2021: 5.19 Mbbl/d total Dec 2021: 6.63 Mbbl/d total Jan 2022: 6.38 Mbbl/d total Feb 2022: 6.42 Mbbl/d total Mar 2022: 6.22 Mbbl/d total Apr 2022: 6.75 Mbbl/d total May 2022: 6.22 Mbbl/d total Jun 2022: 6.05 Mbbl/d total Jul 2022: 5.78 Mbbl/d total Aug 2022: 5.45 Mbbl/d total Sep 2022: 5.31 Mbbl/d total Oct 2022: 4.8 Mbbl/d total Nov 2022: 6.97 Mbbl/d total Dec 2022: 7.25 Mbbl/d total Jan 2023: 6.4 Mbbl/d total Feb 2023: 6.06 Mbbl/d total Mar 2023: 5.85 Mbbl/d total Apr 2023: 5.73 Mbbl/d total May 2023: 5.58 Mbbl/d total Jun 2023: 5.57 Mbbl/d total Jul 2023: 5.01 Mbbl/d total Aug 2023: 5.74 Mbbl/d total Sep 2023: 6.09 Mbbl/d total Oct 2023: 7.35 Mbbl/d total Nov 2023: 7.04 Mbbl/d total Dec 2023: 6.69 Mbbl/d total Jan 2024: 6.39 Mbbl/d total Feb 2024: 5.93 Mbbl/d total Mar 2024: 6.34 Mbbl/d total Apr 2024: 6.05 Mbbl/d total May 2024: 5.43 Mbbl/d total Jun 2024: 5.39 Mbbl/d total Jul 2024: 5.03 Mbbl/d total Aug 2024: 7.57 Mbbl/d total Sep 2024: 8.13 Mbbl/d total Oct 2024: 7.18 Mbbl/d total Nov 2024: 6.18 Mbbl/d total Dec 2024: 6.63 Mbbl/d total Jan 2025: 7.62 Mbbl/d total Feb 2025: 7.36 Mbbl/d total Mar 2025: 7.06 Mbbl/d total Apr 2025: 6.89 Mbbl/d total May 2025: 6.44 Mbbl/d total Jun 2025: 6.34 Mbbl/d total Jul 2025: 5.89 Mbbl/d total Aug 2025: 5.85 Mbbl/d total Sep 2025: 5.65 Mbbl/d total Oct 2025: 5.63 Mbbl/d total Nov 2025: 5.45 Mbbl/d total Dec 2025: 4.96 Mbbl/d total Jan 2026: 4.76 Mbbl/d total Feb 2026: 5.2 Mbbl/d total Mar 2026: 5.26 Mbbl/d total Apr 2026: 5.09 Mbbl/d total May 2026: 4.57 Mbbl/d total Jun 2026: 5.66 Mbbl/d total Jul 2026: ≈6.89 Mbbl/d total (99% arrived, remainder estimated) Aug 2026: ≈10.3 Mbbl/d total (98% arrived, remainder estimated) Sep 2026: ≈7.11 Mbbl/d total (34% arrived, remainder estimated) Oct 2026: ≈6.86 Mbbl/d total (<1% arrived, remainder estimated) Nov 2026: ≈6.77 Mbbl/d total (<1% arrived, remainder estimated)

In this view, hatching marks our estimate, and in the most recent months that is volume still to be filed. Past the divider, the chart continues only the bands it has drawn. Each band continues as our estimate, from any filings already in and then from our forecast, built by summing our per-well forecasts. The method behind each well is recorded with the forecast. The forward months cover existing wells only. How our methods work

All from what the source published. All held at well grain.

How the volume breaks down
  • 88.6% Reported by the official source by well
  • under 0.01% Reported by the official source for a longer period, spread across its months. The period total is the reported number.
  • 11.4% A series adjusted to match official published figures: a well's cumulative, a later correction netted into the months before it, a field's oil volume from the royalty file for a month missing from the production report, or a state's yearly total from a second official source.

Every barrel through June 2026 starts from what the official source published for those months. Measured over January 1967 to June 2026.

Sandoval County, New Mexico natural gas production (MMcf/d, grouped by when each well first produced)
  • filling in (est. · missed) . Hatching marks our estimate of the volume still to be filed. That estimate draws on our own production forecast. A check on the forecast behind this estimate measured a miss. It updates as filings arrive
  • estimated . Hatching marks our estimate. In the most recent months that is volume still to be filed. Past the divider it is our estimate of each whole month, built on any filings already in. Beyond the last filings it is our forecast.
Sandoval County, New Mexico natural gas production: million cubic feet per day, by first-production vintage filed in full 204060 MMcf/d 2017201820192020202120222023202420252026 Dec 2016: 27.6 MMcf/d total Jan 2017: 26.5 MMcf/d total Feb 2017: 25.8 MMcf/d total Mar 2017: 26.4 MMcf/d total Apr 2017: 26 MMcf/d total May 2017: 25.7 MMcf/d total Jun 2017: 34.6 MMcf/d total Jul 2017: 32.8 MMcf/d total Aug 2017: 29.7 MMcf/d total Sep 2017: 41.4 MMcf/d total Oct 2017: 42.9 MMcf/d total Nov 2017: 40.3 MMcf/d total Dec 2017: 37.4 MMcf/d total Jan 2018: 35.2 MMcf/d total Feb 2018: 26.5 MMcf/d total Mar 2018: 42.5 MMcf/d total Apr 2018: 37.7 MMcf/d total May 2018: 36.5 MMcf/d total Jun 2018: 36.4 MMcf/d total Jul 2018: 32 MMcf/d total Aug 2018: 33.2 MMcf/d total Sep 2018: 32.6 MMcf/d total Oct 2018: 32.2 MMcf/d total Nov 2018: 30 MMcf/d total Dec 2018: 29.8 MMcf/d total Jan 2019: 28.2 MMcf/d total Feb 2019: 31.2 MMcf/d total Mar 2019: 45 MMcf/d total Apr 2019: 39.9 MMcf/d total May 2019: 36.6 MMcf/d total Jun 2019: 38.2 MMcf/d total Jul 2019: 36.1 MMcf/d total Aug 2019: 36.2 MMcf/d total Sep 2019: 35.3 MMcf/d total Oct 2019: 33.7 MMcf/d total Nov 2019: 34.9 MMcf/d total Dec 2019: 32.4 MMcf/d total Jan 2020: 31.3 MMcf/d total Feb 2020: 31.8 MMcf/d total Mar 2020: 32.1 MMcf/d total Apr 2020: 25.7 MMcf/d total May 2020: 12.1 MMcf/d total Jun 2020: 30.1 MMcf/d total Jul 2020: 29.8 MMcf/d total Aug 2020: 28.6 MMcf/d total Sep 2020: 27.6 MMcf/d total Oct 2020: 26 MMcf/d total Nov 2020: 25.4 MMcf/d total Dec 2020: 24.3 MMcf/d total Jan 2021: 27.4 MMcf/d total Feb 2021: 30.7 MMcf/d total Mar 2021: 28.1 MMcf/d total Apr 2021: 23.1 MMcf/d total May 2021: 30.1 MMcf/d total Jun 2021: 36.8 MMcf/d total Jul 2021: 36.1 MMcf/d total Aug 2021: 36.4 MMcf/d total Sep 2021: 35.2 MMcf/d total Oct 2021: 35.1 MMcf/d total Nov 2021: 31.8 MMcf/d total Dec 2021: 31.6 MMcf/d total Jan 2022: 30.3 MMcf/d total Feb 2022: 30.6 MMcf/d total Mar 2022: 30.4 MMcf/d total Apr 2022: 33.9 MMcf/d total May 2022: 33 MMcf/d total Jun 2022: 31.4 MMcf/d total Jul 2022: 30.2 MMcf/d total Aug 2022: 29.3 MMcf/d total Sep 2022: 28.2 MMcf/d total Oct 2022: 24.4 MMcf/d total Nov 2022: 31.7 MMcf/d total Dec 2022: 34.2 MMcf/d total Jan 2023: 31.9 MMcf/d total Feb 2023: 29 MMcf/d total Mar 2023: 27.7 MMcf/d total Apr 2023: 27.5 MMcf/d total May 2023: 28.3 MMcf/d total Jun 2023: 28 MMcf/d total Jul 2023: 26.2 MMcf/d total Aug 2023: 27.2 MMcf/d total Sep 2023: 26.8 MMcf/d total Oct 2023: 29.8 MMcf/d total Nov 2023: 29.7 MMcf/d total Dec 2023: 28.6 MMcf/d total Jan 2024: 27.7 MMcf/d total Feb 2024: 29.9 MMcf/d total Mar 2024: 29.5 MMcf/d total Apr 2024: 27.5 MMcf/d total May 2024: 25.7 MMcf/d total Jun 2024: 26 MMcf/d total Jul 2024: 24.5 MMcf/d total Aug 2024: 27.4 MMcf/d total Sep 2024: 29.8 MMcf/d total Oct 2024: 29.2 MMcf/d total Nov 2024: 26.7 MMcf/d total Dec 2024: 26.1 MMcf/d total Jan 2025: 26.2 MMcf/d total Feb 2025: 27 MMcf/d total Mar 2025: 26.1 MMcf/d total Apr 2025: 26.2 MMcf/d total May 2025: 26.1 MMcf/d total Jun 2025: 26.2 MMcf/d total Jul 2025: 25.4 MMcf/d total Aug 2025: 25.8 MMcf/d total Sep 2025: 24.8 MMcf/d total Oct 2025: 24.2 MMcf/d total Nov 2025: 23.2 MMcf/d total Dec 2025: 21.6 MMcf/d total Jan 2026: 21.1 MMcf/d total Feb 2026: 23 MMcf/d total Mar 2026: 22.9 MMcf/d total Apr 2026: 23.3 MMcf/d total May 2026: 20.9 MMcf/d total Jun 2026: 21.4 MMcf/d total Jul 2026: ≈25.9 MMcf/d total (99% arrived, remainder estimated) Aug 2026: ≈30.5 MMcf/d total (98% arrived, remainder estimated) Sep 2026: ≈27.5 MMcf/d total (34% arrived, remainder estimated) Oct 2026: ≈31.5 MMcf/d total (<1% arrived, remainder estimated) Nov 2026: ≈35.6 MMcf/d total (<1% arrived, remainder estimated)

In this view, hatching marks our estimate, and in the most recent months that is volume still to be filed. Past the divider, the chart continues only the bands it has drawn. Each band continues as our estimate, from any filings already in and then from our forecast, built by summing our per-well forecasts. The method behind each well is recorded with the forecast. The forward months cover existing wells only. How our methods work

All from what the source published. All held at well grain.

How the volume breaks down
  • 79.3% Reported by the official source by well
  • under 0.01% Reported by the official source for a longer period, spread across its months. The period total is the reported number.
  • 20.7% A series adjusted to match official published figures: a well's cumulative, a later correction netted into the months before it, a field's oil volume from the royalty file for a month missing from the production report, or a state's yearly total from a second official source.

Every cubic foot through June 2026 starts from what the official source published for those months. Measured over January 1967 to June 2026.

The bands group wells by when they first produced.

About this chart

The stack shows what is holding today's rate up and how much of it is new drilling. In the reported months the bands draw the filings already in. The months still filling in are marked.

Annual table (full history)

best estimate incl. adjusted

YearOil (MMbbl)Gas produced (Bcf)
20252.39
20242.310
20232.210
20222.211
20212.412
20202.210
20192.113
20181.312
20171.412
20161.412
20152.114
20142.010
20130.84
20120.22
20110.12
20100.12
20090.11
20080.11
20070.11
20060.11
20050.11
20040.11
20030.12
20020.11
20010.12
20000.22
19990.12
19980.22
19970.22
19960.32
19950.22
19940.22
19930.22
19920.23
19910.22
19900.22
19890.22
19880.22
19870.22
19860.22
19850.22
19840.22
19830.22
19820.12
19810.12
19800.12
19790.12
19780.22
19770.22
19760.22
19750.21
19740.12
19730.11
19720.21
1971<0.11
1970<0.11
1969<0.11
1968<0.11
1967<0.11

Source: CommoVision (commovision.com)

Monthly table (last 24 months)
MonthOil (Mbbl)Gas produced (MMcf)
2026-08318.3940
2026-07211.1802
2026-06168.2641
2026-05140.9649
2026-04152.3699
2026-03163.0709
2026-02145.7643
2026-01147.6655
2025-12153.7670
2025-11163.5697
2025-10174.5749
2025-09169.3745
2025-08181.3799
2025-07182.5788
2025-06190.2787
2025-05199.7809
2025-04206.8787
2025-03218.7809
2025-02206.1755
2025-01236.1814
2024-12205.6809
2024-11185.4801
2024-10222.6906
2024-09243.7893

Source: CommoVision (commovision.com)

Source: CommoVision · Sandoval County, New Mexico, data through September 2026.

Well map

A map of 1,301 well locations in Sandoval County, New Mexico for which CommoVision holds a published surface coordinate, each drawn where it is and colored by its primary product (green for oil, red for natural gas, gray where undetermined; a spot shared by more than one product shows the one with the most wells there), on a ground of land and water over faint county outlines and place names for orientation, with the drilled wellbore path traced for 161 wells, with a small inset map locating this frame in New Mexico.
  • Oil 744
  • Natural gas 527
  • Undetermined 30
1,301 well locations in Sandoval County, New Mexico, colored by primary product. The drilled path is traced for 161 wells from the directional surveys we hold.
About this map

Undetermined means not enough signal to settle it. Producing wells are the ones that reported oil or gas in the 12 months to Aug 2026.

10.3 Mbbl/d (est.) Aug 2026 oil production Aug 2026 is still filling in. The figure is the filings already in plus an estimate of the part not yet filed. The change compares this estimate with the same month last year. +76.4% vs Aug last year
30.5 MMcf/d (est.) Aug 2026 gas production Aug 2026 is still filling in. The figure is the filings already in plus an estimate of the part not yet filed. The change compares this estimate with the same month last year. +18.4% vs Aug last year
6.3 Mbbl/d 2025 oil production
25.2 MMcf/d 2025 gas production
386 wells Producing wells tracked 12 months to Aug 2026
3.5 Mbbl/d Existing wells, Nov 2027 forecast Our forecast for existing wells.
18 MMcf/d Existing wells, Nov 2027 forecast Our forecast for existing wells.

Type curves

Sandoval County, New Mexico oil type curves (bbl/d per well, log scale, against months on production; cohorts 2010–2026)
Sandoval County, New Mexico oil type curves: average barrels per day per well on a log scale against months on production 2010-2014: 55 wells in curve; starts at 192 bbl/d per well, 133 Mbbl cumulative through month 142 (100% of its wells old enough at that month); the dashed curve runs through month 202, on our forecast where a well’s own record ends2015: 14 wells in curve; starts at 248 bbl/d per well, 179 Mbbl cumulative through month 131 (100% of its wells old enough at that month); the dashed curve runs through month 191, on our forecast where a well’s own record ends2017: 7 wells in curve; starts at 244 bbl/d per well, 170 Mbbl cumulative through month 108 (100% of its wells old enough at that month); the dashed curve runs through month 168, on our forecast where a well’s own record ends2018: 4 wells in curve; starts at 441 bbl/d per well, 254 Mbbl cumulative through month 94 (100% of its wells old enough at that month); the dashed curve runs through month 154, on our forecast where a well’s own record ends2019: 18 wells in curve; starts at 208 bbl/d per well, 267 Mbbl cumulative through month 83 (100% of its wells old enough at that month); the dashed curve runs through month 143, on our forecast where a well’s own record ends2020: 5 wells in curve; starts at 266 bbl/d per well, 254 Mbbl cumulative through month 69 (100% of its wells old enough at that month); the dashed curve runs through month 129, on our forecast where a well’s own record ends2021: 9 wells in curve; starts at 119 bbl/d per well, 218 Mbbl cumulative through month 58 (100% of its wells old enough at that month); the dashed curve runs through month 118, on our forecast where a well’s own record ends2022: 11 wells in curve; starts at 139 bbl/d per well, 95.0 Mbbl cumulative through month 46 (100% of its wells old enough at that month); the dashed curve runs through month 106, on our forecast where a well’s own record ends2023: 6 wells in curve; starts at 368 bbl/d per well, 156 Mbbl cumulative through month 35 (100% of its wells old enough at that month); the dashed curve runs through month 95, on our forecast where a well’s own record ends2024: 12 wells in curve; starts at 259 bbl/d per well, 148 Mbbl cumulative through month 21 (100% of its wells old enough at that month); the dashed curve runs through month 81, on our forecast where a well’s own record ends2026: 10 wells in curve; starts at 180 bbl/d per well, 21.0 Mbbl cumulative through month 2 (100% of its wells old enough at that month); the dashed curve runs through month 62, on our forecast where a well’s own record ends5102050100200500700bbl/d24487296120144168192216Months on production

4 of the drawn cohorts’ wells are not in these curves yet: each is still producing and joins its curve once it carries a forecast.

Sandoval County, New Mexico natural gas type curves (Mcf/d per well, log scale, against months on production; cohorts 2010–2026)
Sandoval County, New Mexico natural gas type curves: average thousand cubic feet per day per well on a log scale against months on production 2010-2014: 55 wells in curve; starts at 389 Mcf/d per well, 0.9 Bcf cumulative through month 142 (100% of its wells old enough at that month); the dashed curve runs through month 202, on our forecast where a well’s own record ends2015: 14 wells in curve; starts at 570 Mcf/d per well, 1.0 Bcf cumulative through month 131 (100% of its wells old enough at that month); the dashed curve runs through month 191, on our forecast where a well’s own record ends2017: 7 wells in curve; starts at 1,824 Mcf/d per well, 1.6 Bcf cumulative through month 108 (100% of its wells old enough at that month); the dashed curve runs through month 168, on our forecast where a well’s own record ends2018: 4 wells in curve; starts at 3,047 Mcf/d per well, 1.5 Bcf cumulative through month 94 (100% of its wells old enough at that month); the dashed curve runs through month 154, on our forecast where a well’s own record ends2019: 18 wells in curve; starts at 392 Mcf/d per well, 0.9 Bcf cumulative through month 83 (100% of its wells old enough at that month); the dashed curve runs through month 143, on our forecast where a well’s own record ends2020: 5 wells in curve; starts at 470 Mcf/d per well, 1.3 Bcf cumulative through month 69 (100% of its wells old enough at that month); the dashed curve runs through month 129, on our forecast where a well’s own record ends2021: 9 wells in curve; starts at 31.4 Mcf/d per well, 0.6 Bcf cumulative through month 58 (100% of its wells old enough at that month); the dashed curve runs through month 118, on our forecast where a well’s own record ends2022: 11 wells in curve; starts at 86.5 Mcf/d per well, 0.4 Bcf cumulative through month 46 (100% of its wells old enough at that month); the dashed curve runs through month 106, on our forecast where a well’s own record ends2023: 6 wells in curve; starts at 252 Mcf/d per well, 0.5 Bcf cumulative through month 35 (100% of its wells old enough at that month); the dashed curve runs through month 95, on our forecast where a well’s own record ends2024: 12 wells in curve; starts at 208 Mcf/d per well, 0.3 Bcf cumulative through month 21 (100% of its wells old enough at that month); the dashed curve runs through month 81, on our forecast where a well’s own record ends2026: 10 wells in curve; starts at 182 Mcf/d per well, 0.0 Bcf cumulative through month 2 (100% of its wells old enough at that month); the dashed curve runs through month 62, on our forecast where a well’s own record ends30501002005001,0002,0004,000Mcf/d24487296120144168192216Months on production

4 of the drawn cohorts’ wells are not in these curves yet: each is still producing and joins its curve once it carries a forecast.

best estimate incl. adjusted

Horizontal wells only. Average production per well, for wells grouped by when they first produced.

How these curves are built

Horizontal wells only: 155 of the 192 wells in these cohorts. Average daily production per well, for wells grouped by when they first produced. Includes every well of the cohort that is old enough at each month, except wells that are still active but not yet covered by our forecasts; those are left out of both the reported and forecast parts until they are. Wells that are shut in or have stopped producing count as zero, so the average reflects the whole group drawn, not just survivors. Rates are calendar-day (volume ÷ days in month). The cumulative axis accumulates those same monthly averages at the average month length. Months not yet fully reported are excluded. The 2010-2014 curve draws those years as one group. The chart opens on average daily rate against months on production, the rate on a log scale. The view control switches to rate against cumulative production per well, on the same log rate scale, or to cumulative production per well against months on production, on a linear scale. Every view draws the same cohorts from the same production history. Each cohort is solid through the last month all the wells in its curve sit inside fully reported data. Past it the dashed curve carries the same wells forward, on our forecast where a well’s own record ends, for up to five years. A dashed curve runs as far as at least nine in ten of its wells are accounted for. A well that is old enough but shut in still counts, as zero. The measured months are what these wells reported. In the forward months each well counts its own reported figure for each month it has one, our forecast for each month it has only that, and zero for the rest. The forward average counts every well in the curve. The drawn forecast runs up to five years past the measured months. Line thickness tracks how many wells each curve is drawn from.

Cohort summary table
First produced Wells in curve Peak oil (bbl/d per well) Month-12 oil (bbl/d per well) Cum oil in series (Mbbl per well) Peak gas (Mcf/d per well) Month-12 gas (Mcf/d per well) Cum gas in series (Bcf per well) Months in series Wells old enough at last month in series Forecast months drawn
2026 10 511 — 21.0 770 — 0.0 2 100% 60
2024 12 518 184 148 728 441 0.3 21 100% 60
2023 6 432 102 156 1,002 402 0.5 35 100% 60
2022 11 298 74.2 95.0 1,202 335 0.4 46 100% 60
2021 9 345 165 218 836 646 0.6 58 100% 60
2020 5 434 217 254 1,638 1,331 1.3 69 100% 60
2019 18 434 206 267 1,480 643 0.9 83 100% 60
2018 4 524 152 254 3,047 873 1.5 94 100% 60
2017 7 477 82.6 170 3,361 957 1.6 108 100% 60
2015 14 386 102 179 909 682 1.0 131 100% 60
2010-2014 55 234 73.2 133 638 493 0.9 142 100% 60

Source: CommoVision (commovision.com)

Source: CommoVision · Sandoval County, New Mexico type curves, per-well production by first-production cohort.

Top operators in Sandoval County, New Mexico, 2025

  1. DJR Operating 51.0%
  2. Enduring Resources 46.4%
  3. Dugan Production Corporation 0.7%
  4. Logos Operating LLC 0.7%
  5. Epic Energy LLC 0.4%
  6. Pride Energy Company 0.2%
  7. Roddy Production Co Inc 0.2%
  8. Hpoc, LLC 0.1%
  9. SAN Juan Resources Inc. 0.1%
  10. Advanced Wireless Communications LLC 0.1%
  11. 6 other operators 0.1%
Top operators in Sandoval County, New Mexico, 2025: full table
OperatorOil (Mbbl/d, 2025)Gas produced (MMcf/d, 2025)Share of output
DJR Operating 3.015.151.0%
Enduring Resources 3.18.246.4%
Dugan Production Corporation 0.00.80.7%
Logos Operating LLC 0.00.50.7%
Epic Energy LLC 0.00.30.4%
Pride Energy Company 0.00.00.2%
Roddy Production Co Inc 0.00.10.2%
Hpoc, LLC (January to October) 0.00.00.1%
SAN Juan Resources Inc. 0.00.10.1%
Advanced Wireless Communications LLC 0.00.00.1%
6 other operators 0.00.10.1%

Mbbl/d = thousand barrels per day · MMcf/d = million cubic feet per day (units).

Source: CommoVision (commovision.com)

Active drilling rigs

0 rigs active in the week to November 6, 2026
±0 rigs vs the same week a year earlier
2 rigs peak week, Sep 2018 (since Nov 2016)
Active drilling rigs by rig type (rigs, weekly count)Source: Baker Hughes
Oil Gas Miscellaneous
Active drilling rigs by rig type: rigs, weekly count 1 2 3 rigs 2017201820192020202120222023202420252026 Week to Nov 11, 2016: 0 rigs total (Oil 0, Gas 0, Miscellaneous 0) Week to Nov 18, 2016: 0 rigs total (Oil 0, Gas 0, Miscellaneous 0) Week to Nov 23, 2016: 0 rigs total (Oil 0, Gas 0, Miscellaneous 0) Week to Dec 2, 2016: 0 rigs total (Oil 0, Gas 0, Miscellaneous 0) Week to Dec 9, 2016: 0 rigs total (Oil 0, Gas 0, Miscellaneous 0) Week to Dec 16, 2016: 0 rigs total (Oil 0, Gas 0, Miscellaneous 0) Week to Dec 23, 2016: 0 rigs total (Oil 0, Gas 0, Miscellaneous 0) Week to Dec 30, 2016: 0 rigs total (Oil 0, Gas 0, Miscellaneous 0) Week to Jan 6, 2017: 0 rigs total (Oil 0, Gas 0, Miscellaneous 0) Week to Jan 13, 2017: 0 rigs total (Oil 0, Gas 0, Miscellaneous 0) Week to Jan 20, 2017: 0 rigs total (Oil 0, Gas 0, Miscellaneous 0) Week to Jan 27, 2017: 0 rigs total (Oil 0, Gas 0, Miscellaneous 0) Week to Feb 3, 2017: 0 rigs total (Oil 0, Gas 0, Miscellaneous 0) Week to Feb 10, 2017: 0 rigs total (Oil 0, Gas 0, Miscellaneous 0) Week to Feb 17, 2017: 0 rigs total (Oil 0, Gas 0, Miscellaneous 0) Week to Feb 24, 2017: 0 rigs total (Oil 0, Gas 0, Miscellaneous 0) Week to Mar 3, 2017: 0 rigs total (Oil 0, Gas 0, Miscellaneous 0) Week to Mar 10, 2017: 0 rigs total (Oil 0, Gas 0, Miscellaneous 0) Week to Mar 17, 2017: 0 rigs total (Oil 0, Gas 0, Miscellaneous 0) Week to Mar 24, 2017: 0 rigs total (Oil 0, Gas 0, Miscellaneous 0) Week to Mar 31, 2017: 0 rigs total (Oil 0, Gas 0, Miscellaneous 0) Week to Apr 7, 2017: 0 rigs total (Oil 0, Gas 0, Miscellaneous 0) Week to Apr 13, 2017: 0 rigs total (Oil 0, Gas 0, Miscellaneous 0) Week to Apr 21, 2017: 0 rigs total (Oil 0, Gas 0, Miscellaneous 0) Week to Apr 28, 2017: 0 rigs total (Oil 0, Gas 0, Miscellaneous 0) Week to May 5, 2017: 0 rigs total (Oil 0, Gas 0, Miscellaneous 0) Week to May 12, 2017: 0 rigs total (Oil 0, Gas 0, Miscellaneous 0) Week to May 19, 2017: 0 rigs total (Oil 0, Gas 0, Miscellaneous 0) Week to May 26, 2017: 0 rigs total (Oil 0, Gas 0, Miscellaneous 0) Week to Jun 2, 2017: 0 rigs total (Oil 0, Gas 0, Miscellaneous 0) Week to Jun 9, 2017: 0 rigs total (Oil 0, Gas 0, Miscellaneous 0) Week to Jun 16, 2017: 0 rigs total (Oil 0, Gas 0, Miscellaneous 0) Week to Jun 23, 2017: 0 rigs total (Oil 0, Gas 0, Miscellaneous 0) Week to Jun 30, 2017: 0 rigs total (Oil 0, Gas 0, Miscellaneous 0) Week to Jul 7, 2017: 1 rig total (Oil 1, Gas 0, Miscellaneous 0) Week to Jul 14, 2017: 1 rig total (Oil 1, Gas 0, Miscellaneous 0) Week to Jul 21, 2017: 1 rig total (Oil 1, Gas 0, Miscellaneous 0) Week to Jul 28, 2017: 1 rig total (Oil 1, Gas 0, Miscellaneous 0) Week to Aug 4, 2017: 1 rig total (Oil 1, Gas 0, Miscellaneous 0) Week to Aug 11, 2017: 1 rig total (Oil 1, Gas 0, Miscellaneous 0) Week to Aug 18, 2017: 0 rigs total (Oil 0, Gas 0, Miscellaneous 0) Week to Aug 25, 2017: 0 rigs total (Oil 0, Gas 0, Miscellaneous 0) Week to Sep 1, 2017: 0 rigs total (Oil 0, Gas 0, Miscellaneous 0) Week to Sep 8, 2017: 0 rigs total (Oil 0, Gas 0, Miscellaneous 0) Week to Sep 15, 2017: 0 rigs total (Oil 0, Gas 0, Miscellaneous 0) Week to Sep 22, 2017: 0 rigs total (Oil 0, Gas 0, Miscellaneous 0) Week to Sep 29, 2017: 0 rigs total (Oil 0, Gas 0, Miscellaneous 0) Week to Oct 6, 2017: 0 rigs total (Oil 0, Gas 0, Miscellaneous 0) Week to Oct 13, 2017: 0 rigs total (Oil 0, Gas 0, Miscellaneous 0) Week to Oct 20, 2017: 0 rigs total (Oil 0, Gas 0, Miscellaneous 0) Week to Oct 27, 2017: 0 rigs total (Oil 0, Gas 0, Miscellaneous 0) Week to Nov 3, 2017: 1 rig total (Oil 1, Gas 0, Miscellaneous 0) Week to Nov 10, 2017: 1 rig total (Oil 1, Gas 0, Miscellaneous 0) Week to Nov 17, 2017: 1 rig total (Oil 1, Gas 0, Miscellaneous 0) Week to Nov 22, 2017: 1 rig total (Oil 1, Gas 0, Miscellaneous 0) Week to Dec 1, 2017: 1 rig total (Oil 1, Gas 0, Miscellaneous 0) Week to Dec 8, 2017: 1 rig total (Oil 1, Gas 0, Miscellaneous 0) Week to Dec 15, 2017: 1 rig total (Oil 1, Gas 0, Miscellaneous 0) Week to Dec 22, 2017: 1 rig total (Oil 1, Gas 0, Miscellaneous 0) Week to Dec 29, 2017: 1 rig total (Oil 1, Gas 0, Miscellaneous 0) Week to Jan 5, 2018: 0 rigs total (Oil 0, Gas 0, Miscellaneous 0) Week to Jan 12, 2018: 0 rigs total (Oil 0, Gas 0, Miscellaneous 0) Week to Jan 19, 2018: 0 rigs total (Oil 0, Gas 0, Miscellaneous 0) Week to Jan 26, 2018: 0 rigs total (Oil 0, Gas 0, Miscellaneous 0) Week to Feb 2, 2018: 0 rigs total (Oil 0, Gas 0, Miscellaneous 0) Week to Feb 9, 2018: 0 rigs total (Oil 0, Gas 0, Miscellaneous 0) Week to Feb 16, 2018: 0 rigs total (Oil 0, Gas 0, Miscellaneous 0) Week to Feb 23, 2018: 0 rigs total (Oil 0, Gas 0, Miscellaneous 0) Week to Mar 2, 2018: 0 rigs total (Oil 0, Gas 0, Miscellaneous 0) Week to Mar 9, 2018: 0 rigs total (Oil 0, Gas 0, Miscellaneous 0) Week to Mar 16, 2018: 0 rigs total (Oil 0, Gas 0, Miscellaneous 0) Week to Mar 23, 2018: 0 rigs total (Oil 0, Gas 0, Miscellaneous 0) Week to Mar 29, 2018: 0 rigs total (Oil 0, Gas 0, Miscellaneous 0) Week to Apr 6, 2018: 0 rigs total (Oil 0, Gas 0, Miscellaneous 0) Week to Apr 13, 2018: 0 rigs total (Oil 0, Gas 0, Miscellaneous 0) Week to Apr 20, 2018: 0 rigs total (Oil 0, Gas 0, Miscellaneous 0) Week to Apr 27, 2018: 0 rigs total (Oil 0, Gas 0, Miscellaneous 0) Week to May 4, 2018: 0 rigs total (Oil 0, Gas 0, Miscellaneous 0) Week to May 11, 2018: 0 rigs total (Oil 0, Gas 0, Miscellaneous 0) Week to May 18, 2018: 0 rigs total (Oil 0, Gas 0, Miscellaneous 0) Week to May 25, 2018: 0 rigs total (Oil 0, Gas 0, Miscellaneous 0) Week to Jun 1, 2018: 0 rigs total (Oil 0, Gas 0, Miscellaneous 0) Week to Jun 8, 2018: 0 rigs total (Oil 0, Gas 0, Miscellaneous 0) Week to Jun 15, 2018: 0 rigs total (Oil 0, Gas 0, Miscellaneous 0) Week to Jun 22, 2018: 0 rigs total (Oil 0, Gas 0, Miscellaneous 0) Week to Jun 29, 2018: 0 rigs total (Oil 0, Gas 0, Miscellaneous 0) Week to Jul 6, 2018: 0 rigs total (Oil 0, Gas 0, Miscellaneous 0) Week to Jul 13, 2018: 0 rigs total (Oil 0, Gas 0, Miscellaneous 0) Week to Jul 20, 2018: 0 rigs total (Oil 0, Gas 0, Miscellaneous 0) Week to Jul 27, 2018: 0 rigs total (Oil 0, Gas 0, Miscellaneous 0) Week to Aug 3, 2018: 0 rigs total (Oil 0, Gas 0, Miscellaneous 0) Week to Aug 10, 2018: 0 rigs total (Oil 0, Gas 0, Miscellaneous 0) Week to Aug 17, 2018: 0 rigs total (Oil 0, Gas 0, Miscellaneous 0) Week to Aug 24, 2018: 0 rigs total (Oil 0, Gas 0, Miscellaneous 0) Week to Aug 31, 2018: 0 rigs total (Oil 0, Gas 0, Miscellaneous 0) Week to Sep 7, 2018: 0 rigs total (Oil 0, Gas 0, Miscellaneous 0) Week to Sep 14, 2018: 2 rigs total (Oil 2, Gas 0, Miscellaneous 0) Week to Sep 21, 2018: 2 rigs total (Oil 2, Gas 0, Miscellaneous 0) Week to Sep 28, 2018: 2 rigs total (Oil 2, Gas 0, Miscellaneous 0) Week to Oct 5, 2018: 1 rig total (Oil 1, Gas 0, Miscellaneous 0) Week to Oct 12, 2018: 1 rig total (Oil 1, Gas 0, Miscellaneous 0) Week to Oct 19, 2018: 0 rigs total (Oil 0, Gas 0, Miscellaneous 0) Week to Oct 26, 2018: 0 rigs total (Oil 0, Gas 0, Miscellaneous 0) Week to Nov 2, 2018: 0 rigs total (Oil 0, Gas 0, Miscellaneous 0) Week to Nov 9, 2018: 0 rigs total (Oil 0, Gas 0, Miscellaneous 0) Week to Nov 16, 2018: 0 rigs total (Oil 0, Gas 0, Miscellaneous 0) Week to Nov 21, 2018: 0 rigs total (Oil 0, Gas 0, Miscellaneous 0) Week to Nov 30, 2018: 0 rigs total (Oil 0, Gas 0, Miscellaneous 0) Week to Dec 7, 2018: 0 rigs total (Oil 0, Gas 0, Miscellaneous 0) Week to Dec 14, 2018: 0 rigs total (Oil 0, Gas 0, Miscellaneous 0) Week to Dec 21, 2018: 0 rigs total (Oil 0, Gas 0, Miscellaneous 0) Week to Dec 28, 2018: 0 rigs total (Oil 0, Gas 0, Miscellaneous 0) Week to Jan 4, 2019: 1 rig total (Oil 1, Gas 0, Miscellaneous 0) Week to Jan 11, 2019: 1 rig total (Oil 1, Gas 0, Miscellaneous 0) Week to Jan 18, 2019: 1 rig total (Oil 1, Gas 0, Miscellaneous 0) Week to Jan 25, 2019: 1 rig total (Oil 1, Gas 0, Miscellaneous 0) Week to Feb 1, 2019: 1 rig total (Oil 1, Gas 0, Miscellaneous 0) Week to Feb 8, 2019: 1 rig total (Oil 1, Gas 0, Miscellaneous 0) Week to Feb 15, 2019: 1 rig total (Oil 1, Gas 0, Miscellaneous 0) Week to Feb 22, 2019: 1 rig total (Oil 1, Gas 0, Miscellaneous 0) Week to Mar 1, 2019: 0 rigs total (Oil 0, Gas 0, Miscellaneous 0) Week to Mar 8, 2019: 0 rigs total (Oil 0, Gas 0, Miscellaneous 0) Week to Mar 15, 2019: 0 rigs total (Oil 0, Gas 0, Miscellaneous 0) Week to Mar 22, 2019: 0 rigs total (Oil 0, Gas 0, Miscellaneous 0) Week to Mar 29, 2019: 0 rigs total (Oil 0, Gas 0, Miscellaneous 0) Week to Apr 5, 2019: 0 rigs total (Oil 0, Gas 0, Miscellaneous 0) Week to Apr 12, 2019: 0 rigs total (Oil 0, Gas 0, Miscellaneous 0) Week to Apr 18, 2019: 0 rigs total (Oil 0, Gas 0, Miscellaneous 0) Week to Apr 26, 2019: 0 rigs total (Oil 0, Gas 0, Miscellaneous 0) Week to May 3, 2019: 0 rigs total (Oil 0, Gas 0, Miscellaneous 0) Week to May 10, 2019: 0 rigs total (Oil 0, Gas 0, Miscellaneous 0) Week to May 17, 2019: 0 rigs total (Oil 0, Gas 0, Miscellaneous 0) Week to May 24, 2019: 0 rigs total (Oil 0, Gas 0, Miscellaneous 0) Week to May 31, 2019: 0 rigs total (Oil 0, Gas 0, Miscellaneous 0) Week to Jun 7, 2019: 0 rigs total (Oil 0, Gas 0, Miscellaneous 0) Week to Jun 14, 2019: 0 rigs total (Oil 0, Gas 0, Miscellaneous 0) Week to Jun 21, 2019: 0 rigs total (Oil 0, Gas 0, Miscellaneous 0) Week to Jun 28, 2019: 0 rigs total (Oil 0, Gas 0, Miscellaneous 0) Week to Jul 3, 2019: 0 rigs total (Oil 0, Gas 0, Miscellaneous 0) Week to Jul 12, 2019: 0 rigs total (Oil 0, Gas 0, Miscellaneous 0) Week to Jul 19, 2019: 0 rigs total (Oil 0, Gas 0, Miscellaneous 0) Week to Jul 26, 2019: 0 rigs total (Oil 0, Gas 0, Miscellaneous 0) Week to Aug 2, 2019: 0 rigs total (Oil 0, Gas 0, Miscellaneous 0) Week to Aug 9, 2019: 0 rigs total (Oil 0, Gas 0, Miscellaneous 0) Week to Aug 16, 2019: 0 rigs total (Oil 0, Gas 0, Miscellaneous 0) Week to Aug 23, 2019: 0 rigs total (Oil 0, Gas 0, Miscellaneous 0) Week to Aug 30, 2019: 0 rigs total (Oil 0, Gas 0, Miscellaneous 0) Week to Sep 6, 2019: 0 rigs total (Oil 0, Gas 0, Miscellaneous 0) Week to Sep 13, 2019: 0 rigs total (Oil 0, Gas 0, Miscellaneous 0) Week to Sep 20, 2019: 0 rigs total (Oil 0, Gas 0, Miscellaneous 0) Week to Sep 27, 2019: 0 rigs total (Oil 0, Gas 0, Miscellaneous 0) Week to Oct 4, 2019: 0 rigs total (Oil 0, Gas 0, Miscellaneous 0) Week to Oct 11, 2019: 0 rigs total (Oil 0, Gas 0, Miscellaneous 0) Week to Oct 18, 2019: 0 rigs total (Oil 0, Gas 0, Miscellaneous 0) Week to Oct 25, 2019: 0 rigs total (Oil 0, Gas 0, Miscellaneous 0) Week to Nov 1, 2019: 0 rigs total (Oil 0, Gas 0, Miscellaneous 0) Week to Nov 8, 2019: 0 rigs total (Oil 0, Gas 0, Miscellaneous 0) Week to Nov 15, 2019: 0 rigs total (Oil 0, Gas 0, Miscellaneous 0) Week to Nov 22, 2019: 0 rigs total (Oil 0, Gas 0, Miscellaneous 0) Week to Nov 27, 2019: 0 rigs total (Oil 0, Gas 0, Miscellaneous 0) Week to Dec 6, 2019: 0 rigs total (Oil 0, Gas 0, Miscellaneous 0) Week to Dec 13, 2019: 0 rigs total (Oil 0, Gas 0, Miscellaneous 0) Week to Dec 20, 2019: 0 rigs total (Oil 0, Gas 0, Miscellaneous 0) Week to Dec 27, 2019: 0 rigs total (Oil 0, Gas 0, Miscellaneous 0) Week to Jan 3, 2020: 0 rigs total (Oil 0, Gas 0, Miscellaneous 0) Week to Jan 10, 2020: 0 rigs total (Oil 0, Gas 0, Miscellaneous 0) Week to Jan 17, 2020: 0 rigs total (Oil 0, Gas 0, Miscellaneous 0) Week to Jan 24, 2020: 0 rigs total (Oil 0, Gas 0, Miscellaneous 0) Week to Jan 31, 2020: 0 rigs total (Oil 0, Gas 0, Miscellaneous 0) Week to Feb 7, 2020: 0 rigs total (Oil 0, Gas 0, Miscellaneous 0) Week to Feb 14, 2020: 0 rigs total (Oil 0, Gas 0, Miscellaneous 0) Week to Feb 21, 2020: 0 rigs total (Oil 0, Gas 0, Miscellaneous 0) Week to Feb 28, 2020: 0 rigs total (Oil 0, Gas 0, Miscellaneous 0) Week to Mar 6, 2020: 0 rigs total (Oil 0, Gas 0, Miscellaneous 0) Week to Mar 13, 2020: 0 rigs total (Oil 0, Gas 0, Miscellaneous 0) Week to Mar 20, 2020: 0 rigs total (Oil 0, Gas 0, Miscellaneous 0) Week to Mar 27, 2020: 0 rigs total (Oil 0, Gas 0, Miscellaneous 0) Week to Apr 3, 2020: 0 rigs total (Oil 0, Gas 0, Miscellaneous 0) Week to Apr 9, 2020: 0 rigs total (Oil 0, Gas 0, Miscellaneous 0) Week to Apr 17, 2020: 0 rigs total (Oil 0, Gas 0, Miscellaneous 0) Week to Apr 24, 2020: 0 rigs total (Oil 0, Gas 0, Miscellaneous 0) Week to May 1, 2020: 0 rigs total (Oil 0, Gas 0, Miscellaneous 0) Week to May 8, 2020: 0 rigs total (Oil 0, Gas 0, Miscellaneous 0) Week to May 15, 2020: 0 rigs total (Oil 0, Gas 0, Miscellaneous 0) Week to May 22, 2020: 0 rigs total (Oil 0, Gas 0, Miscellaneous 0) Week to May 29, 2020: 0 rigs total (Oil 0, Gas 0, Miscellaneous 0) Week to Jun 5, 2020: 0 rigs total (Oil 0, Gas 0, Miscellaneous 0) Week to Jun 12, 2020: 0 rigs total (Oil 0, Gas 0, Miscellaneous 0) Week to Jun 19, 2020: 0 rigs total (Oil 0, Gas 0, Miscellaneous 0) Week to Jun 26, 2020: 0 rigs total (Oil 0, Gas 0, Miscellaneous 0) Week to Jul 2, 2020: 0 rigs total (Oil 0, Gas 0, Miscellaneous 0) Week to Jul 10, 2020: 0 rigs total (Oil 0, Gas 0, Miscellaneous 0) Week to Jul 17, 2020: 0 rigs total (Oil 0, Gas 0, Miscellaneous 0) Week to Jul 24, 2020: 0 rigs total (Oil 0, Gas 0, Miscellaneous 0) Week to Jul 31, 2020: 0 rigs total (Oil 0, Gas 0, Miscellaneous 0) Week to Aug 7, 2020: 0 rigs total (Oil 0, Gas 0, Miscellaneous 0) Week to Aug 14, 2020: 0 rigs total (Oil 0, Gas 0, Miscellaneous 0) Week to Aug 21, 2020: 0 rigs total (Oil 0, Gas 0, Miscellaneous 0) Week to Aug 28, 2020: 0 rigs total (Oil 0, Gas 0, Miscellaneous 0) Week to Sep 4, 2020: 0 rigs total (Oil 0, Gas 0, Miscellaneous 0) Week to Sep 11, 2020: 0 rigs total (Oil 0, Gas 0, Miscellaneous 0) Week to Sep 18, 2020: 0 rigs total (Oil 0, Gas 0, Miscellaneous 0) Week to Sep 25, 2020: 0 rigs total (Oil 0, Gas 0, Miscellaneous 0) Week to Oct 2, 2020: 0 rigs total (Oil 0, Gas 0, Miscellaneous 0) Week to Oct 9, 2020: 0 rigs total (Oil 0, Gas 0, Miscellaneous 0) Week to Oct 16, 2020: 0 rigs total (Oil 0, Gas 0, Miscellaneous 0) Week to Oct 23, 2020: 0 rigs total (Oil 0, Gas 0, Miscellaneous 0) Week to Oct 30, 2020: 0 rigs total (Oil 0, Gas 0, Miscellaneous 0) Week to Nov 6, 2020: 0 rigs total (Oil 0, Gas 0, Miscellaneous 0) Week to Nov 13, 2020: 0 rigs total (Oil 0, Gas 0, Miscellaneous 0) Week to Nov 20, 2020: 0 rigs total (Oil 0, Gas 0, Miscellaneous 0) Week to Nov 25, 2020: 0 rigs total (Oil 0, Gas 0, Miscellaneous 0) Week to Dec 4, 2020: 0 rigs total (Oil 0, Gas 0, Miscellaneous 0) Week to Dec 11, 2020: 0 rigs total (Oil 0, Gas 0, Miscellaneous 0) Week to Dec 18, 2020: 0 rigs total (Oil 0, Gas 0, Miscellaneous 0) Week to Dec 23, 2020: 0 rigs total (Oil 0, Gas 0, Miscellaneous 0) Week to Dec 31, 2020: 0 rigs total (Oil 0, Gas 0, Miscellaneous 0) Week to Jan 8, 2021: 0 rigs total (Oil 0, Gas 0, Miscellaneous 0) Week to Jan 15, 2021: 0 rigs total (Oil 0, Gas 0, Miscellaneous 0) Week to Jan 22, 2021: 0 rigs total (Oil 0, Gas 0, Miscellaneous 0) Week to Jan 29, 2021: 0 rigs total (Oil 0, Gas 0, Miscellaneous 0) Week to Feb 5, 2021: 0 rigs total (Oil 0, Gas 0, Miscellaneous 0) Week to Feb 12, 2021: 0 rigs total (Oil 0, Gas 0, Miscellaneous 0) Week to Feb 19, 2021: 0 rigs total (Oil 0, Gas 0, Miscellaneous 0) Week to Feb 26, 2021: 0 rigs total (Oil 0, Gas 0, Miscellaneous 0) Week to Mar 5, 2021: 0 rigs total (Oil 0, Gas 0, Miscellaneous 0) Week to Mar 12, 2021: 0 rigs total (Oil 0, Gas 0, Miscellaneous 0) Week to Mar 19, 2021: 0 rigs total (Oil 0, Gas 0, Miscellaneous 0) Week to Mar 26, 2021: 0 rigs total (Oil 0, Gas 0, Miscellaneous 0) Week to Apr 1, 2021: 0 rigs total (Oil 0, Gas 0, Miscellaneous 0) Week to Apr 9, 2021: 0 rigs total (Oil 0, Gas 0, Miscellaneous 0) Week to Apr 16, 2021: 0 rigs total (Oil 0, Gas 0, Miscellaneous 0) Week to Apr 23, 2021: 0 rigs total (Oil 0, Gas 0, Miscellaneous 0) Week to Apr 30, 2021: 0 rigs total (Oil 0, Gas 0, Miscellaneous 0) Week to May 7, 2021: 0 rigs total (Oil 0, Gas 0, Miscellaneous 0) Week to May 14, 2021: 0 rigs total (Oil 0, Gas 0, Miscellaneous 0) Week to May 21, 2021: 0 rigs total (Oil 0, Gas 0, Miscellaneous 0) Week to May 28, 2021: 0 rigs total (Oil 0, Gas 0, Miscellaneous 0) Week to Jun 4, 2021: 0 rigs total (Oil 0, Gas 0, Miscellaneous 0) Week to Jun 11, 2021: 0 rigs total (Oil 0, Gas 0, Miscellaneous 0) Week to Jun 18, 2021: 0 rigs total (Oil 0, Gas 0, Miscellaneous 0) Week to Jun 25, 2021: 0 rigs total (Oil 0, Gas 0, Miscellaneous 0) Week to Jul 2, 2021: 0 rigs total (Oil 0, Gas 0, Miscellaneous 0) Week to Jul 9, 2021: 0 rigs total (Oil 0, Gas 0, Miscellaneous 0) Week to Jul 16, 2021: 0 rigs total (Oil 0, Gas 0, Miscellaneous 0) Week to Jul 23, 2021: 0 rigs total (Oil 0, Gas 0, Miscellaneous 0) Week to Jul 30, 2021: 0 rigs total (Oil 0, Gas 0, Miscellaneous 0) Week to Aug 6, 2021: 0 rigs total (Oil 0, Gas 0, Miscellaneous 0) Week to Aug 13, 2021: 0 rigs total (Oil 0, Gas 0, Miscellaneous 0) Week to Aug 20, 2021: 0 rigs total (Oil 0, Gas 0, Miscellaneous 0) Week to Aug 27, 2021: 0 rigs total (Oil 0, Gas 0, Miscellaneous 0) Week to Sep 3, 2021: 0 rigs total (Oil 0, Gas 0, Miscellaneous 0) Week to Sep 10, 2021: 0 rigs total (Oil 0, Gas 0, Miscellaneous 0) Week to Sep 17, 2021: 0 rigs total (Oil 0, Gas 0, Miscellaneous 0) Week to Sep 24, 2021: 0 rigs total (Oil 0, Gas 0, Miscellaneous 0) Week to Oct 1, 2021: 0 rigs total (Oil 0, Gas 0, Miscellaneous 0) Week to Oct 8, 2021: 0 rigs total (Oil 0, Gas 0, Miscellaneous 0) Week to Oct 15, 2021: 0 rigs total (Oil 0, Gas 0, Miscellaneous 0) Week to Oct 22, 2021: 0 rigs total (Oil 0, Gas 0, Miscellaneous 0) Week to Oct 29, 2021: 0 rigs total (Oil 0, Gas 0, Miscellaneous 0) Week to Nov 5, 2021: 0 rigs total (Oil 0, Gas 0, Miscellaneous 0) Week to Nov 12, 2021: 0 rigs total (Oil 0, Gas 0, Miscellaneous 0) Week to Nov 19, 2021: 0 rigs total (Oil 0, Gas 0, Miscellaneous 0) Week to Nov 24, 2021: 0 rigs total (Oil 0, Gas 0, Miscellaneous 0) Week to Dec 3, 2021: 0 rigs total (Oil 0, Gas 0, Miscellaneous 0) Week to Dec 10, 2021: 0 rigs total (Oil 0, Gas 0, Miscellaneous 0) Week to Dec 17, 2021: 0 rigs total (Oil 0, Gas 0, Miscellaneous 0) Week to Dec 23, 2021: 0 rigs total (Oil 0, Gas 0, Miscellaneous 0) Week to Dec 31, 2021: 0 rigs total (Oil 0, Gas 0, Miscellaneous 0) Week to Jan 7, 2022: 0 rigs total (Oil 0, Gas 0, Miscellaneous 0) Week to Jan 14, 2022: 0 rigs total (Oil 0, Gas 0, Miscellaneous 0) Week to Jan 21, 2022: 0 rigs total (Oil 0, Gas 0, Miscellaneous 0) Week to Jan 28, 2022: 0 rigs total (Oil 0, Gas 0, Miscellaneous 0) Week to Feb 4, 2022: 0 rigs total (Oil 0, Gas 0, Miscellaneous 0) Week to Feb 11, 2022: 0 rigs total (Oil 0, Gas 0, Miscellaneous 0) Week to Feb 18, 2022: 0 rigs total (Oil 0, Gas 0, Miscellaneous 0) Week to Feb 25, 2022: 0 rigs total (Oil 0, Gas 0, Miscellaneous 0) Week to Mar 4, 2022: 0 rigs total (Oil 0, Gas 0, Miscellaneous 0) Week to Mar 11, 2022: 0 rigs total (Oil 0, Gas 0, Miscellaneous 0) Week to Mar 18, 2022: 0 rigs total (Oil 0, Gas 0, Miscellaneous 0) Week to Mar 25, 2022: 0 rigs total (Oil 0, Gas 0, Miscellaneous 0) Week to Apr 1, 2022: 0 rigs total (Oil 0, Gas 0, Miscellaneous 0) Week to Apr 8, 2022: 0 rigs total (Oil 0, Gas 0, Miscellaneous 0) Week to Apr 14, 2022: 0 rigs total (Oil 0, Gas 0, Miscellaneous 0) Week to Apr 22, 2022: 0 rigs total (Oil 0, Gas 0, Miscellaneous 0) Week to Apr 29, 2022: 0 rigs total (Oil 0, Gas 0, Miscellaneous 0) Week to May 6, 2022: 0 rigs total (Oil 0, Gas 0, Miscellaneous 0) Week to May 13, 2022: 0 rigs total (Oil 0, Gas 0, Miscellaneous 0) Week to May 20, 2022: 0 rigs total (Oil 0, Gas 0, Miscellaneous 0) Week to May 27, 2022: 0 rigs total (Oil 0, Gas 0, Miscellaneous 0) Week to Jun 3, 2022: 1 rig total (Oil 0, Gas 1, Miscellaneous 0) Week to Jun 10, 2022: 1 rig total (Oil 0, Gas 1, Miscellaneous 0) Week to Jun 17, 2022: 1 rig total (Oil 0, Gas 1, Miscellaneous 0) Week to Jun 24, 2022: 1 rig total (Oil 0, Gas 1, Miscellaneous 0) Week to Jul 1, 2022: 1 rig total (Oil 0, Gas 1, Miscellaneous 0) Week to Jul 8, 2022: 1 rig total (Oil 0, Gas 1, Miscellaneous 0) Week to Jul 15, 2022: 1 rig total (Oil 0, Gas 1, Miscellaneous 0) Week to Jul 22, 2022: 1 rig total (Oil 0, Gas 1, Miscellaneous 0) Week to Jul 29, 2022: 1 rig total (Oil 0, Gas 1, Miscellaneous 0) Week to Aug 5, 2022: 2 rigs total (Oil 0, Gas 2, Miscellaneous 0) Week to Aug 12, 2022: 2 rigs total (Oil 0, Gas 2, Miscellaneous 0) Week to Aug 19, 2022: 2 rigs total (Oil 0, Gas 2, Miscellaneous 0) Week to Aug 26, 2022: 2 rigs total (Oil 0, Gas 2, Miscellaneous 0) Week to Sep 2, 2022: 2 rigs total (Oil 0, Gas 2, Miscellaneous 0) Week to Sep 9, 2022: 2 rigs total (Oil 0, Gas 2, Miscellaneous 0) Week to Sep 16, 2022: 2 rigs total (Oil 0, Gas 2, Miscellaneous 0) Week to Sep 23, 2022: 2 rigs total (Oil 0, Gas 2, Miscellaneous 0) Week to Sep 30, 2022: 2 rigs total (Oil 0, Gas 2, Miscellaneous 0) Week to Oct 7, 2022: 2 rigs total (Oil 0, Gas 2, Miscellaneous 0) Week to Oct 14, 2022: 2 rigs total (Oil 0, Gas 2, Miscellaneous 0) Week to Oct 21, 2022: 2 rigs total (Oil 0, Gas 2, Miscellaneous 0) Week to Oct 28, 2022: 2 rigs total (Oil 0, Gas 2, Miscellaneous 0) Week to Nov 4, 2022: 2 rigs total (Oil 0, Gas 2, Miscellaneous 0) Week to Nov 10, 2022: 2 rigs total (Oil 0, Gas 2, Miscellaneous 0) Week to Nov 18, 2022: 1 rig total (Oil 0, Gas 1, Miscellaneous 0) Week to Nov 23, 2022: 1 rig total (Oil 0, Gas 1, Miscellaneous 0) Week to Dec 2, 2022: 1 rig total (Oil 0, Gas 1, Miscellaneous 0) Week to Dec 9, 2022: 1 rig total (Oil 0, Gas 1, Miscellaneous 0) Week to Dec 16, 2022: 1 rig total (Oil 0, Gas 1, Miscellaneous 0) Week to Dec 22, 2022: 1 rig total (Oil 0, Gas 1, Miscellaneous 0) Week to Dec 30, 2022: 0 rigs total (Oil 0, Gas 0, Miscellaneous 0) Week to Jan 6, 2023: 0 rigs total (Oil 0, Gas 0, Miscellaneous 0) Week to Jan 13, 2023: 0 rigs total (Oil 0, Gas 0, Miscellaneous 0) Week to Jan 20, 2023: 0 rigs total (Oil 0, Gas 0, Miscellaneous 0) Week to Jan 27, 2023: 0 rigs total (Oil 0, Gas 0, Miscellaneous 0) Week to Feb 3, 2023: 0 rigs total (Oil 0, Gas 0, Miscellaneous 0) Week to Feb 10, 2023: 0 rigs total (Oil 0, Gas 0, Miscellaneous 0) Week to Feb 17, 2023: 0 rigs total (Oil 0, Gas 0, Miscellaneous 0) Week to Feb 24, 2023: 0 rigs total (Oil 0, Gas 0, Miscellaneous 0) Week to Mar 3, 2023: 0 rigs total (Oil 0, Gas 0, Miscellaneous 0) Week to Mar 10, 2023: 0 rigs total (Oil 0, Gas 0, Miscellaneous 0) Week to Mar 17, 2023: 0 rigs total (Oil 0, Gas 0, Miscellaneous 0) Week to Mar 24, 2023: 0 rigs total (Oil 0, Gas 0, Miscellaneous 0) Week to Mar 31, 2023: 0 rigs total (Oil 0, Gas 0, Miscellaneous 0) Week to Apr 6, 2023: 0 rigs total (Oil 0, Gas 0, Miscellaneous 0) Week to Apr 14, 2023: 0 rigs total (Oil 0, Gas 0, Miscellaneous 0) Week to Apr 21, 2023: 0 rigs total (Oil 0, Gas 0, Miscellaneous 0) Week to Apr 28, 2023: 0 rigs total (Oil 0, Gas 0, Miscellaneous 0) Week to May 5, 2023: 0 rigs total (Oil 0, Gas 0, Miscellaneous 0) Week to May 12, 2023: 0 rigs total (Oil 0, Gas 0, Miscellaneous 0) Week to May 19, 2023: 0 rigs total (Oil 0, Gas 0, Miscellaneous 0) Week to May 26, 2023: 0 rigs total (Oil 0, Gas 0, Miscellaneous 0) Week to Jun 2, 2023: 0 rigs total (Oil 0, Gas 0, Miscellaneous 0) Week to Jun 9, 2023: 0 rigs total (Oil 0, Gas 0, Miscellaneous 0) Week to Jun 16, 2023: 0 rigs total (Oil 0, Gas 0, Miscellaneous 0) Week to Jun 23, 2023: 0 rigs total (Oil 0, Gas 0, Miscellaneous 0) Week to Jun 30, 2023: 0 rigs total (Oil 0, Gas 0, Miscellaneous 0) Week to Jul 7, 2023: 0 rigs total (Oil 0, Gas 0, Miscellaneous 0) Week to Jul 14, 2023: 0 rigs total (Oil 0, Gas 0, Miscellaneous 0) Week to Jul 21, 2023: 0 rigs total (Oil 0, Gas 0, Miscellaneous 0) Week to Jul 28, 2023: 0 rigs total (Oil 0, Gas 0, Miscellaneous 0) Week to Aug 4, 2023: 0 rigs total (Oil 0, Gas 0, Miscellaneous 0) Week to Aug 11, 2023: 0 rigs total (Oil 0, Gas 0, Miscellaneous 0) Week to Aug 18, 2023: 0 rigs total (Oil 0, Gas 0, Miscellaneous 0) Week to Aug 25, 2023: 0 rigs total (Oil 0, Gas 0, Miscellaneous 0) Week to Sep 1, 2023: 0 rigs total (Oil 0, Gas 0, Miscellaneous 0) Week to Sep 8, 2023: 0 rigs total (Oil 0, Gas 0, Miscellaneous 0) Week to Sep 15, 2023: 0 rigs total (Oil 0, Gas 0, Miscellaneous 0) Week to Sep 22, 2023: 0 rigs total (Oil 0, Gas 0, Miscellaneous 0) Week to Sep 29, 2023: 0 rigs total (Oil 0, Gas 0, Miscellaneous 0) Week to Oct 6, 2023: 0 rigs total (Oil 0, Gas 0, Miscellaneous 0) Week to Oct 13, 2023: 0 rigs total (Oil 0, Gas 0, Miscellaneous 0) Week to Oct 20, 2023: 0 rigs total (Oil 0, Gas 0, Miscellaneous 0) Week to Oct 27, 2023: 0 rigs total (Oil 0, Gas 0, Miscellaneous 0) Week to Nov 3, 2023: 0 rigs total (Oil 0, Gas 0, Miscellaneous 0) Week to Nov 10, 2023: 0 rigs total (Oil 0, Gas 0, Miscellaneous 0) Week to Nov 17, 2023: 0 rigs total (Oil 0, Gas 0, Miscellaneous 0) Week to Nov 22, 2023: 0 rigs total (Oil 0, Gas 0, Miscellaneous 0) Week to Dec 1, 2023: 0 rigs total (Oil 0, Gas 0, Miscellaneous 0) Week to Dec 8, 2023: 0 rigs total (Oil 0, Gas 0, Miscellaneous 0) Week to Dec 15, 2023: 0 rigs total (Oil 0, Gas 0, Miscellaneous 0) Week to Dec 21, 2023: 0 rigs total (Oil 0, Gas 0, Miscellaneous 0) Week to Dec 29, 2023: 0 rigs total (Oil 0, Gas 0, Miscellaneous 0) Week to Jan 5, 2024: 0 rigs total (Oil 0, Gas 0, Miscellaneous 0) Week to Jan 12, 2024: 0 rigs total (Oil 0, Gas 0, Miscellaneous 0) Week to Jan 19, 2024: 0 rigs total (Oil 0, Gas 0, Miscellaneous 0) Week to Jan 26, 2024: 0 rigs total (Oil 0, Gas 0, Miscellaneous 0) Week to Feb 2, 2024: 0 rigs total (Oil 0, Gas 0, Miscellaneous 0) Week to Feb 9, 2024: 0 rigs total (Oil 0, Gas 0, Miscellaneous 0) Week to Feb 16, 2024: 0 rigs total (Oil 0, Gas 0, Miscellaneous 0) Week to Feb 23, 2024: 0 rigs total (Oil 0, Gas 0, Miscellaneous 0) Week to Mar 1, 2024: 0 rigs total (Oil 0, Gas 0, Miscellaneous 0) Week to Mar 8, 2024: 0 rigs total (Oil 0, Gas 0, Miscellaneous 0) Week to Mar 15, 2024: 0 rigs total (Oil 0, Gas 0, Miscellaneous 0) Week to Mar 22, 2024: 0 rigs total (Oil 0, Gas 0, Miscellaneous 0) Week to Mar 28, 2024: 0 rigs total (Oil 0, Gas 0, Miscellaneous 0) Week to Apr 5, 2024: 0 rigs total (Oil 0, Gas 0, Miscellaneous 0) Week to Apr 12, 2024: 0 rigs total (Oil 0, Gas 0, Miscellaneous 0) Week to Apr 19, 2024: 0 rigs total (Oil 0, Gas 0, Miscellaneous 0) Week to Apr 26, 2024: 0 rigs total (Oil 0, Gas 0, Miscellaneous 0) Week to May 3, 2024: 0 rigs total (Oil 0, Gas 0, Miscellaneous 0) Week to May 10, 2024: 0 rigs total (Oil 0, Gas 0, Miscellaneous 0) Week to May 17, 2024: 0 rigs total (Oil 0, Gas 0, Miscellaneous 0) Week to May 24, 2024: 0 rigs total (Oil 0, Gas 0, Miscellaneous 0) Week to May 31, 2024: 0 rigs total (Oil 0, Gas 0, Miscellaneous 0) Week to Jun 7, 2024: 0 rigs total (Oil 0, Gas 0, Miscellaneous 0) Week to Jun 14, 2024: 0 rigs total (Oil 0, Gas 0, Miscellaneous 0) Week to Jun 21, 2024: 0 rigs total (Oil 0, Gas 0, Miscellaneous 0) Week to Jun 28, 2024: 0 rigs total (Oil 0, Gas 0, Miscellaneous 0) Week to Jul 5, 2024: 0 rigs total (Oil 0, Gas 0, Miscellaneous 0) Week to Jul 12, 2024: 0 rigs total (Oil 0, Gas 0, Miscellaneous 0) Week to Jul 19, 2024: 0 rigs total (Oil 0, Gas 0, Miscellaneous 0) Week to Jul 26, 2024: 0 rigs total (Oil 0, Gas 0, Miscellaneous 0) Week to Aug 2, 2024: 0 rigs total (Oil 0, Gas 0, Miscellaneous 0) Week to Aug 9, 2024: 0 rigs total (Oil 0, Gas 0, Miscellaneous 0) Week to Aug 16, 2024: 0 rigs total (Oil 0, Gas 0, Miscellaneous 0) Week to Aug 23, 2024: 0 rigs total (Oil 0, Gas 0, Miscellaneous 0) Week to Aug 30, 2024: 0 rigs total (Oil 0, Gas 0, Miscellaneous 0) Week to Sep 6, 2024: 0 rigs total (Oil 0, Gas 0, Miscellaneous 0) Week to Sep 13, 2024: 0 rigs total (Oil 0, Gas 0, Miscellaneous 0) Week to Sep 20, 2024: 0 rigs total (Oil 0, Gas 0, Miscellaneous 0) Week to Sep 27, 2024: 0 rigs total (Oil 0, Gas 0, Miscellaneous 0) Week to Oct 4, 2024: 1 rig total (Oil 0, Gas 1, Miscellaneous 0) Week to Oct 11, 2024: 1 rig total (Oil 0, Gas 1, Miscellaneous 0) Week to Oct 18, 2024: 1 rig total (Oil 0, Gas 1, Miscellaneous 0) Week to Oct 25, 2024: 1 rig total (Oil 0, Gas 1, Miscellaneous 0) Week to Nov 1, 2024: 1 rig total (Oil 0, Gas 1, Miscellaneous 0) Week to Nov 8, 2024: 1 rig total (Oil 0, Gas 1, Miscellaneous 0) Week to Nov 15, 2024: 1 rig total (Oil 0, Gas 1, Miscellaneous 0) Week to Nov 22, 2024: 1 rig total (Oil 0, Gas 1, Miscellaneous 0) Week to Nov 27, 2024: 1 rig total (Oil 0, Gas 1, Miscellaneous 0) Week to Dec 6, 2024: 0 rigs total (Oil 0, Gas 0, Miscellaneous 0) Week to Dec 13, 2024: 0 rigs total (Oil 0, Gas 0, Miscellaneous 0) Week to Dec 20, 2024: 0 rigs total (Oil 0, Gas 0, Miscellaneous 0) Week to Dec 27, 2024: 0 rigs total (Oil 0, Gas 0, Miscellaneous 0) Week to Jan 3, 2025: 0 rigs total (Oil 0, Gas 0, Miscellaneous 0) Week to Jan 10, 2025: 0 rigs total (Oil 0, Gas 0, Miscellaneous 0) Week to Jan 17, 2025: 0 rigs total (Oil 0, Gas 0, Miscellaneous 0) Week to Jan 24, 2025: 0 rigs total (Oil 0, Gas 0, Miscellaneous 0) Week to Jan 31, 2025: 0 rigs total (Oil 0, Gas 0, Miscellaneous 0) Week to Feb 7, 2025: 0 rigs total (Oil 0, Gas 0, Miscellaneous 0) Week to Feb 14, 2025: 0 rigs total (Oil 0, Gas 0, Miscellaneous 0) Week to Feb 21, 2025: 0 rigs total (Oil 0, Gas 0, Miscellaneous 0) Week to Feb 28, 2025: 0 rigs total (Oil 0, Gas 0, Miscellaneous 0) Week to Mar 7, 2025: 0 rigs total (Oil 0, Gas 0, Miscellaneous 0) Week to Mar 14, 2025: 0 rigs total (Oil 0, Gas 0, Miscellaneous 0) Week to Mar 21, 2025: 0 rigs total (Oil 0, Gas 0, Miscellaneous 0) Week to Mar 28, 2025: 0 rigs total (Oil 0, Gas 0, Miscellaneous 0) Week to Apr 4, 2025: 0 rigs total (Oil 0, Gas 0, Miscellaneous 0) Week to Apr 11, 2025: 0 rigs total (Oil 0, Gas 0, Miscellaneous 0) Week to Apr 17, 2025: 0 rigs total (Oil 0, Gas 0, Miscellaneous 0) Week to Apr 25, 2025: 0 rigs total (Oil 0, Gas 0, Miscellaneous 0) Week to May 2, 2025: 0 rigs total (Oil 0, Gas 0, Miscellaneous 0) Week to May 9, 2025: 0 rigs total (Oil 0, Gas 0, Miscellaneous 0) Week to May 16, 2025: 0 rigs total (Oil 0, Gas 0, Miscellaneous 0) Week to May 23, 2025: 0 rigs total (Oil 0, Gas 0, Miscellaneous 0) Week to May 30, 2025: 0 rigs total (Oil 0, Gas 0, Miscellaneous 0) Week to Jun 6, 2025: 0 rigs total (Oil 0, Gas 0, Miscellaneous 0) Week to Jun 13, 2025: 0 rigs total (Oil 0, Gas 0, Miscellaneous 0) Week to Jun 20, 2025: 0 rigs total (Oil 0, Gas 0, Miscellaneous 0) Week to Jun 27, 2025: 0 rigs total (Oil 0, Gas 0, Miscellaneous 0) Week to Jul 3, 2025: 0 rigs total (Oil 0, Gas 0, Miscellaneous 0) Week to Jul 11, 2025: 0 rigs total (Oil 0, Gas 0, Miscellaneous 0) Week to Jul 18, 2025: 0 rigs total (Oil 0, Gas 0, Miscellaneous 0) Week to Jul 25, 2025: 0 rigs total (Oil 0, Gas 0, Miscellaneous 0) Week to Aug 1, 2025: 0 rigs total (Oil 0, Gas 0, Miscellaneous 0) Week to Aug 8, 2025: 0 rigs total (Oil 0, Gas 0, Miscellaneous 0) Week to Aug 15, 2025: 0 rigs total (Oil 0, Gas 0, Miscellaneous 0) Week to Aug 22, 2025: 0 rigs total (Oil 0, Gas 0, Miscellaneous 0) Week to Aug 29, 2025: 0 rigs total (Oil 0, Gas 0, Miscellaneous 0) Week to Sep 5, 2025: 0 rigs total (Oil 0, Gas 0, Miscellaneous 0) Week to Sep 12, 2025: 0 rigs total (Oil 0, Gas 0, Miscellaneous 0) Week to Sep 19, 2025: 0 rigs total (Oil 0, Gas 0, Miscellaneous 0) Week to Sep 26, 2025: 0 rigs total (Oil 0, Gas 0, Miscellaneous 0) Week to Oct 3, 2025: 0 rigs total (Oil 0, Gas 0, Miscellaneous 0) Week to Oct 10, 2025: 0 rigs total (Oil 0, Gas 0, Miscellaneous 0) Week to Oct 17, 2025: 0 rigs total (Oil 0, Gas 0, Miscellaneous 0) Week to Oct 24, 2025: 0 rigs total (Oil 0, Gas 0, Miscellaneous 0) Week to Oct 31, 2025: 0 rigs total (Oil 0, Gas 0, Miscellaneous 0) Week to Nov 6, 2025: 0 rigs total (Oil 0, Gas 0, Miscellaneous 0) Week to Nov 14, 2025: 0 rigs total (Oil 0, Gas 0, Miscellaneous 0) Week to Nov 21, 2025: 0 rigs total (Oil 0, Gas 0, Miscellaneous 0) Week to Nov 26, 2025: 0 rigs total (Oil 0, Gas 0, Miscellaneous 0) Week to Dec 4, 2025: 0 rigs total (Oil 0, Gas 0, Miscellaneous 0) Week to Dec 12, 2025: 0 rigs total (Oil 0, Gas 0, Miscellaneous 0) Week to Dec 19, 2025: 0 rigs total (Oil 0, Gas 0, Miscellaneous 0) Week to Dec 24, 2025: 0 rigs total (Oil 0, Gas 0, Miscellaneous 0) Week to Dec 30, 2025: 0 rigs total (Oil 0, Gas 0, Miscellaneous 0) Week to Jan 9, 2026: 0 rigs total (Oil 0, Gas 0, Miscellaneous 0) Week to Jan 16, 2026: 0 rigs total (Oil 0, Gas 0, Miscellaneous 0) Week to Jan 23, 2026: 0 rigs total (Oil 0, Gas 0, Miscellaneous 0) Week to Jan 30, 2026: 0 rigs total (Oil 0, Gas 0, Miscellaneous 0) Week to Feb 6, 2026: 0 rigs total (Oil 0, Gas 0, Miscellaneous 0) Week to Feb 13, 2026: 0 rigs total (Oil 0, Gas 0, Miscellaneous 0) Week to Feb 20, 2026: 0 rigs total (Oil 0, Gas 0, Miscellaneous 0) Week to Feb 27, 2026: 0 rigs total (Oil 0, Gas 0, Miscellaneous 0) Week to Mar 6, 2026: 0 rigs total (Oil 0, Gas 0, Miscellaneous 0) Week to Mar 13, 2026: 0 rigs total (Oil 0, Gas 0, Miscellaneous 0) Week to Mar 20, 2026: 0 rigs total (Oil 0, Gas 0, Miscellaneous 0) Week to Mar 27, 2026: 0 rigs total (Oil 0, Gas 0, Miscellaneous 0) Week to Apr 2, 2026: 0 rigs total (Oil 0, Gas 0, Miscellaneous 0) Week to Apr 10, 2026: 0 rigs total (Oil 0, Gas 0, Miscellaneous 0) Week to Apr 17, 2026: 0 rigs total (Oil 0, Gas 0, Miscellaneous 0) Week to Apr 24, 2026: 0 rigs total (Oil 0, Gas 0, Miscellaneous 0) Week to May 1, 2026: 0 rigs total (Oil 0, Gas 0, Miscellaneous 0) Week to May 8, 2026: 0 rigs total (Oil 0, Gas 0, Miscellaneous 0) Week to May 15, 2026: 0 rigs total (Oil 0, Gas 0, Miscellaneous 0) Week to May 22, 2026: 0 rigs total (Oil 0, Gas 0, Miscellaneous 0) Week to May 29, 2026: 0 rigs total (Oil 0, Gas 0, Miscellaneous 0) Week to Jun 5, 2026: 0 rigs total (Oil 0, Gas 0, Miscellaneous 0) Week to Jun 12, 2026: 0 rigs total (Oil 0, Gas 0, Miscellaneous 0) Week to Jun 18, 2026: 0 rigs total (Oil 0, Gas 0, Miscellaneous 0) Week to Jun 26, 2026: 0 rigs total (Oil 0, Gas 0, Miscellaneous 0) Week to Jul 2, 2026: 0 rigs total (Oil 0, Gas 0, Miscellaneous 0) Week to Jul 10, 2026: 0 rigs total (Oil 0, Gas 0, Miscellaneous 0) Week to Jul 17, 2026: 0 rigs total (Oil 0, Gas 0, Miscellaneous 0) Week to Jul 24, 2026: 0 rigs total (Oil 0, Gas 0, Miscellaneous 0) Week to Jul 31, 2026: 0 rigs total (Oil 0, Gas 0, Miscellaneous 0) Week to Aug 7, 2026: 0 rigs total (Oil 0, Gas 0, Miscellaneous 0) Week to Aug 14, 2026: 0 rigs total (Oil 0, Gas 0, Miscellaneous 0) Week to Aug 21, 2026: 0 rigs total (Oil 0, Gas 0, Miscellaneous 0) Week to Aug 28, 2026: 0 rigs total (Oil 0, Gas 0, Miscellaneous 0) Week to Sep 4, 2026: 0 rigs total (Oil 0, Gas 0, Miscellaneous 0) Week to Sep 11, 2026: 0 rigs total (Oil 0, Gas 0, Miscellaneous 0) Week to Sep 18, 2026: 0 rigs total (Oil 0, Gas 0, Miscellaneous 0) Week to Sep 25, 2026: 0 rigs total (Oil 0, Gas 0, Miscellaneous 0) Week to Oct 2, 2026: 0 rigs total (Oil 0, Gas 0, Miscellaneous 0) Week to Oct 9, 2026: 0 rigs total (Oil 0, Gas 0, Miscellaneous 0) Week to Oct 16, 2026: 0 rigs total (Oil 0, Gas 0, Miscellaneous 0) Week to Oct 23, 2026: 0 rigs total (Oil 0, Gas 0, Miscellaneous 0) Week to Oct 30, 2026: 0 rigs total (Oil 0, Gas 0, Miscellaneous 0) Week to Nov 6, 2026: 0 rigs total (Oil 0, Gas 0, Miscellaneous 0)

Interactive chart. Focus it and use the left and right arrow keys to read each week, Page Up and Page Down to move a year, Home and End for the ends of the series. The full figures are also in the table below.

  • In Sandoval County, New Mexico, 0 drilling rigs were active in the week to November 6, 2026 (unchanged from a year earlier).
  • Since Nov 2016, the weekly count peaked at 2 in Sep 2018.
  • The count covers land and inland-water rigs; rigs in US federal offshore waters are counted on the Gulf of Mexico page.
Average active rigs per month: full table
Month Oil-directedGas-directedMiscellaneousAll rigs
Nov 2026 (through November 6, 2026)0000
Oct 20260000
Sep 20260000
Aug 20260000
Jul 20260000
Jun 20260000
May 20260000
Apr 20260000
Mar 20260000
Feb 20260000
Jan 20260000
Dec 20250000
Nov 20250000
Oct 20250000
Sep 20250000
Aug 20250000
Jul 20250000
Jun 20250000
May 20250000
Apr 20250000
Mar 20250000
Feb 20250000
Jan 20250000
Dec 20240000

Source: CommoVision (commovision.com)

What we cover here

Each row names the grain a region’s production is held at. Where a source publishes at a coarser grain, the page says so.

DataGrainSinceBenchmark
New Mexico production well 1924-01 ~98–100% of EIA

Benchmark cells compare our series with the EIA’s published estimates.

About the EIA comparison

The two are produced differently: the EIA estimates from a survey of the largest operators and a model built to anticipate late filings, while the series compared here are rebuilt from official records as they arrive. Recent months can differ without either being wrong; the methodology page explains both methods.

Coverage rows for Sandoval County, New Mexico are regenerated at every build from the same catalog of sources the data is built from.

What the data shows

  • Sandoval County, New Mexico produced 2.3 MMbbl of oil and 9.2 Bcf of natural gas in 2025.
  • Sandoval County, New Mexico oil production peaked in 2021 at 2.4 MMbbl; 2025 output of 2.3 MMbbl ran at 94% of that peak.
  • 386 producing wells tracked, 12 months to Aug 2026.

Start a free trial

Watch supply move as soon as its sources publish, with forecasts on 1.1+ million producing wells. A real API and MCP access for AI tools are live, and the Portal is open.

What the trial includes

Data use is subject to our Terms of Service.