CommoVision

See the future in real time

Karnes County, Texas

Karnes County, Texas produced 100.0 MMbbl of oil and 310.1 Bcf of natural gas in 2025. 5,560 producing wells tracked, 12 months to Jun 2026.

  • Sixth-largest oil-producing county in Texas, 2025.
  • 4.8% of the oil produced in Texas, 2025.
  • Oil production rose 6% in 2025 from 2024.
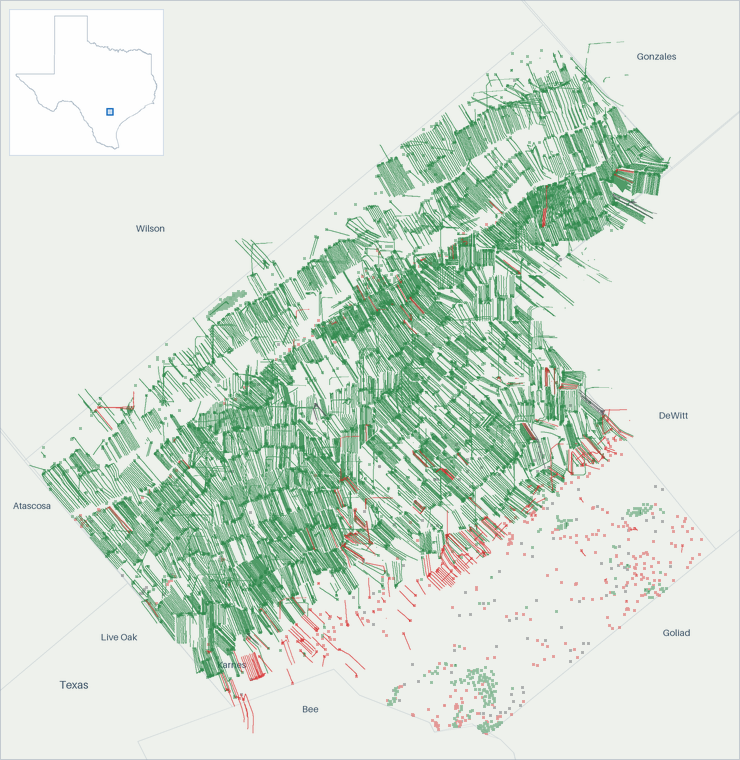
Well map of Karnes County, Texas. The full map is further down this page.

Production

Karnes County, Texas oil production (Mbbl/d, monthly average, grouped by when each well first produced)
  • filling in (est.) . Months in the hatched zone are partly reported. The part not yet filed is estimated from recent production rates. It updates as filings arrive
  • estimated . Hatching marks our estimate. In the most recent months that is volume still to be filed. Past the divider it is our forecast.
Karnes County, Texas oil production: thousand barrels per day, by first-production vintage filed in full today 100200300400 Mbbl/d 2017201820192020202120222023202420252026 Jul 2016: 262 Mbbl/d total Aug 2016: 258 Mbbl/d total Sep 2016: 272 Mbbl/d total Oct 2016: 269 Mbbl/d total Nov 2016: 269 Mbbl/d total Dec 2016: 271 Mbbl/d total Jan 2017: 271 Mbbl/d total Feb 2017: 287 Mbbl/d total Mar 2017: 308 Mbbl/d total Apr 2017: 302 Mbbl/d total May 2017: 300 Mbbl/d total Jun 2017: 302 Mbbl/d total Jul 2017: 300 Mbbl/d total Aug 2017: 257 Mbbl/d total Sep 2017: 299 Mbbl/d total Oct 2017: 344 Mbbl/d total Nov 2017: 349 Mbbl/d total Dec 2017: 342 Mbbl/d total Jan 2018: 323 Mbbl/d total Feb 2018: 322 Mbbl/d total Mar 2018: 335 Mbbl/d total Apr 2018: 340 Mbbl/d total May 2018: 354 Mbbl/d total Jun 2018: 354 Mbbl/d total Jul 2018: 350 Mbbl/d total Aug 2018: 351 Mbbl/d total Sep 2018: 354 Mbbl/d total Oct 2018: 343 Mbbl/d total Nov 2018: 373 Mbbl/d total Dec 2018: 381 Mbbl/d total Jan 2019: 360 Mbbl/d total Feb 2019: 337 Mbbl/d total Mar 2019: 320 Mbbl/d total Apr 2019: 324 Mbbl/d total May 2019: 332 Mbbl/d total Jun 2019: 350 Mbbl/d total Jul 2019: 348 Mbbl/d total Aug 2019: 349 Mbbl/d total Sep 2019: 359 Mbbl/d total Oct 2019: 349 Mbbl/d total Nov 2019: 351 Mbbl/d total Dec 2019: 358 Mbbl/d total Jan 2020: 361 Mbbl/d total Feb 2020: 368 Mbbl/d total Mar 2020: 362 Mbbl/d total Apr 2020: 333 Mbbl/d total May 2020: 261 Mbbl/d total Jun 2020: 264 Mbbl/d total Jul 2020: 262 Mbbl/d total Aug 2020: 260 Mbbl/d total Sep 2020: 257 Mbbl/d total Oct 2020: 284 Mbbl/d total Nov 2020: 279 Mbbl/d total Dec 2020: 256 Mbbl/d total Jan 2021: 252 Mbbl/d total Feb 2021: 215 Mbbl/d total Mar 2021: 279 Mbbl/d total Apr 2021: 294 Mbbl/d total May 2021: 316 Mbbl/d total Jun 2021: 319 Mbbl/d total Jul 2021: 309 Mbbl/d total Aug 2021: 301 Mbbl/d total Sep 2021: 322 Mbbl/d total Oct 2021: 312 Mbbl/d total Nov 2021: 325 Mbbl/d total Dec 2021: 320 Mbbl/d total Jan 2022: 315 Mbbl/d total Feb 2022: 324 Mbbl/d total Mar 2022: 322 Mbbl/d total Apr 2022: 316 Mbbl/d total May 2022: 332 Mbbl/d total Jun 2022: 359 Mbbl/d total Jul 2022: 338 Mbbl/d total Aug 2022: 330 Mbbl/d total Sep 2022: 313 Mbbl/d total Oct 2022: 297 Mbbl/d total Nov 2022: 283 Mbbl/d total Dec 2022: 273 Mbbl/d total Jan 2023: 287 Mbbl/d total Feb 2023: 269 Mbbl/d total Mar 2023: 289 Mbbl/d total Apr 2023: 279 Mbbl/d total May 2023: 278 Mbbl/d total Jun 2023: 285 Mbbl/d total Jul 2023: 279 Mbbl/d total Aug 2023: 278 Mbbl/d total Sep 2023: 273 Mbbl/d total Oct 2023: 272 Mbbl/d total Nov 2023: 259 Mbbl/d total Dec 2023: 247 Mbbl/d total Jan 2024: 225 Mbbl/d total Feb 2024: 237 Mbbl/d total Mar 2024: 236 Mbbl/d total Apr 2024: 249 Mbbl/d total May 2024: 270 Mbbl/d total Jun 2024: 260 Mbbl/d total Jul 2024: 248 Mbbl/d total Aug 2024: 272 Mbbl/d total Sep 2024: 291 Mbbl/d total Oct 2024: 288 Mbbl/d total Nov 2024: 272 Mbbl/d total Dec 2024: 259 Mbbl/d total Jan 2025: 255 Mbbl/d total Feb 2025: 277 Mbbl/d total Mar 2025: 282 Mbbl/d total Apr 2025: 295 Mbbl/d total May 2025: 303 Mbbl/d total Jun 2025: 303 Mbbl/d total Jul 2025: 296 Mbbl/d total Aug 2025: 294 Mbbl/d total Sep 2025: 269 Mbbl/d total Oct 2025: 246 Mbbl/d total Nov 2025: 239 Mbbl/d total Dec 2025: 231 Mbbl/d total Jan 2026: 231 Mbbl/d total Feb 2026: 212 Mbbl/d total Mar 2026: ≈220 Mbbl/d total (99% arrived, remainder estimated) Apr 2026: ≈218 Mbbl/d total (98% arrived, remainder estimated) May 2026: ≈239 Mbbl/d total (97% arrived, remainder estimated) Jun 2026: ≈231 Mbbl/d total (98% arrived, remainder estimated)

Still arriving: Jul 2026 8% filed, Aug 2026 <1% filed.

In this view, hatching marks our estimate, and in the most recent months that is volume still to be filed. Past the divider, the chart continues only the bands it has drawn. Each band continues as our forecast, built by summing our per-well forecasts. The method behind each well is recorded with the forecast. The forward months add no new wells. How our methods work

All from what the source published. All held at well grain.

How the volume breaks down
  • 40.3% Reported by the official source by well
  • 59.7% Reported by the official source as a lease total, split across the lease's wells. The regional total shown is the reported number, to rounding.

Every barrel through February 2026 starts from what the official source published for those months. Measured over January 1993 to February 2026.

Karnes County, Texas natural gas production (MMcf/d, monthly average, grouped by when each well first produced)
  • filling in (est.) . Months in the hatched zone are partly reported. The part not yet filed is estimated from recent production rates. It updates as filings arrive
  • estimated . Hatching marks our estimate. In the most recent months that is volume still to be filed. Past the divider it is our forecast.
Karnes County, Texas natural gas production: million cubic feet per day, by first-production vintage filed in full today 5001,0001,500 MMcf/d 2017201820192020202120222023202420252026 Jul 2016: 754 MMcf/d total Aug 2016: 751 MMcf/d total Sep 2016: 743 MMcf/d total Oct 2016: 745 MMcf/d total Nov 2016: 744 MMcf/d total Dec 2016: 723 MMcf/d total Jan 2017: 715 MMcf/d total Feb 2017: 738 MMcf/d total Mar 2017: 753 MMcf/d total Apr 2017: 761 MMcf/d total May 2017: 766 MMcf/d total Jun 2017: 781 MMcf/d total Jul 2017: 830 MMcf/d total Aug 2017: 728 MMcf/d total Sep 2017: 809 MMcf/d total Oct 2017: 891 MMcf/d total Nov 2017: 894 MMcf/d total Dec 2017: 875 MMcf/d total Jan 2018: 824 MMcf/d total Feb 2018: 836 MMcf/d total Mar 2018: 885 MMcf/d total Apr 2018: 877 MMcf/d total May 2018: 929 MMcf/d total Jun 2018: 936 MMcf/d total Jul 2018: 950 MMcf/d total Aug 2018: 943 MMcf/d total Sep 2018: 951 MMcf/d total Oct 2018: 949 MMcf/d total Nov 2018: 1,015 MMcf/d total Dec 2018: 1,044 MMcf/d total Jan 2019: 1,013 MMcf/d total Feb 2019: 989 MMcf/d total Mar 2019: 959 MMcf/d total Apr 2019: 943 MMcf/d total May 2019: 945 MMcf/d total Jun 2019: 1,007 MMcf/d total Jul 2019: 991 MMcf/d total Aug 2019: 993 MMcf/d total Sep 2019: 1,003 MMcf/d total Oct 2019: 973 MMcf/d total Nov 2019: 968 MMcf/d total Dec 2019: 995 MMcf/d total Jan 2020: 1,000 MMcf/d total Feb 2020: 1,021 MMcf/d total Mar 2020: 993 MMcf/d total Apr 2020: 956 MMcf/d total May 2020: 818 MMcf/d total Jun 2020: 786 MMcf/d total Jul 2020: 785 MMcf/d total Aug 2020: 777 MMcf/d total Sep 2020: 763 MMcf/d total Oct 2020: 778 MMcf/d total Nov 2020: 784 MMcf/d total Dec 2020: 739 MMcf/d total Jan 2021: 723 MMcf/d total Feb 2021: 603 MMcf/d total Mar 2021: 772 MMcf/d total Apr 2021: 822 MMcf/d total May 2021: 850 MMcf/d total Jun 2021: 876 MMcf/d total Jul 2021: 853 MMcf/d total Aug 2021: 822 MMcf/d total Sep 2021: 842 MMcf/d total Oct 2021: 817 MMcf/d total Nov 2021: 822 MMcf/d total Dec 2021: 826 MMcf/d total Jan 2022: 801 MMcf/d total Feb 2022: 814 MMcf/d total Mar 2022: 819 MMcf/d total Apr 2022: 804 MMcf/d total May 2022: 833 MMcf/d total Jun 2022: 908 MMcf/d total Jul 2022: 901 MMcf/d total Aug 2022: 940 MMcf/d total Sep 2022: 898 MMcf/d total Oct 2022: 870 MMcf/d total Nov 2022: 838 MMcf/d total Dec 2022: 784 MMcf/d total Jan 2023: 853 MMcf/d total Feb 2023: 812 MMcf/d total Mar 2023: 874 MMcf/d total Apr 2023: 833 MMcf/d total May 2023: 855 MMcf/d total Jun 2023: 880 MMcf/d total Jul 2023: 861 MMcf/d total Aug 2023: 850 MMcf/d total Sep 2023: 865 MMcf/d total Oct 2023: 888 MMcf/d total Nov 2023: 838 MMcf/d total Dec 2023: 808 MMcf/d total Jan 2024: 742 MMcf/d total Feb 2024: 767 MMcf/d total Mar 2024: 766 MMcf/d total Apr 2024: 791 MMcf/d total May 2024: 901 MMcf/d total Jun 2024: 870 MMcf/d total Jul 2024: 831 MMcf/d total Aug 2024: 890 MMcf/d total Sep 2024: 915 MMcf/d total Oct 2024: 942 MMcf/d total Nov 2024: 906 MMcf/d total Dec 2024: 856 MMcf/d total Jan 2025: 827 MMcf/d total Feb 2025: 884 MMcf/d total Mar 2025: 909 MMcf/d total Apr 2025: 924 MMcf/d total May 2025: 921 MMcf/d total Jun 2025: 903 MMcf/d total Jul 2025: 879 MMcf/d total Aug 2025: 874 MMcf/d total Sep 2025: 822 MMcf/d total Oct 2025: 776 MMcf/d total Nov 2025: 763 MMcf/d total Dec 2025: 716 MMcf/d total Jan 2026: 711 MMcf/d total Feb 2026: 723 MMcf/d total Mar 2026: ≈699 MMcf/d total (99% arrived, remainder estimated) Apr 2026: ≈1,397 MMcf/d total (98% arrived, remainder estimated) May 2026: ≈685 MMcf/d total (97% arrived, remainder estimated) Jun 2026: ≈679 MMcf/d total (98% arrived, remainder estimated)

Still arriving: Jul 2026 8% filed, Aug 2026 <1% filed.

In this view, hatching marks our estimate, and in the most recent months that is volume still to be filed. Past the divider, the chart continues only the bands it has drawn. Each band continues as our forecast, built by summing our per-well forecasts. The method behind each well is recorded with the forecast. The forward months add no new wells. How our methods work

All from what the source published. All held at well grain.

How the volume breaks down
  • 59.8% Reported by the official source by well
  • 40.2% Reported by the official source as a lease total, split across the lease's wells. The regional total shown is the reported number, to rounding.

Every cubic foot through February 2026 starts from what the official source published for those months. Measured over January 1993 to February 2026.

The bands group wells by when they first produced.

About this chart

The stack shows what is holding today's rate up and how much of it is new drilling. In the reported months the bands draw the filings already in. The months still filling in are marked.

Texas reports production two ways: for an oil lease or unit, and for an individual gas well. A figure reported for a lease or unit is divided among the wells it covers, and every Texas barrel is labeled reported or allocated. How well-level Texas production is built

Annual table (full history)

best estimate incl. allocated

YearOil (MMbbl)Gas produced (Bcf)
2025100.0310
202494.8310
2023100.2311
2022115.6311
2021108.6293
2020108.1311
2019125.9358
2018127.2339
2017111.4290
2016101.8285
2015121.6291
2014108.8231
201379.3174
201250.4114
201118.151
20103.018
20090.511
20080.411
20070.48
20060.47
20050.49
20040.410
20030.413
20020.38
20010.37
20000.49
19990.511
19980.510
19970.512
19960.511
19950.510
19940.611
19930.712

Source: CommoVision (commovision.com)

Monthly table (last 24 months)
MonthOil (Mbbl)Gas produced (MMcf)
2026-066,817.019,848
2026-057,206.820,540
2026-046,413.441,410
2026-036,726.121,662
2026-025,948.020,248
2026-017,169.522,031
2025-127,146.022,203
2025-117,168.222,897
2025-107,634.924,061
2025-098,056.624,655
2025-089,111.527,106
2025-079,191.027,236
2025-069,084.927,099
2025-059,380.028,556
2025-048,847.227,723
2025-038,730.228,189
2025-027,763.524,741
2025-017,904.625,641
2024-128,041.226,541
2024-118,145.627,192
2024-108,924.229,197
2024-098,737.427,449
2024-088,419.327,595
2024-077,683.025,775

Source: CommoVision (commovision.com)

Source: CommoVision · Karnes County, Texas, data through June 2026.

Well map

A map of 7,455 well locations in Karnes County, Texas for which CommoVision holds a published surface coordinate, each drawn where it is and colored by its primary product (green for oil, red for natural gas, gray where undetermined; a spot shared by more than one product shows the one with the most wells there), on a ground of land and water over faint county outlines and place names for orientation, with the drilled wellbore path traced for 5,858 wells, with a small inset map locating this frame in Texas.
  • Oil 6,621
  • Natural gas 617
  • Undetermined 217
7,455 well locations in Karnes County, Texas, colored by primary product. The drilled path is traced for 5,858 wells from the directional surveys we hold.
About this map

Undetermined means not enough signal to settle it. Producing wells are the ones that reported oil or gas in the 12 months to Jun 2026.

231 Mbbl/d (est.) Jun 2026 oil production Jun 2026 is still filling in. The figure is the filings already in plus an estimate of the part not yet filed. The change compares this estimate with the same month last year. -23.7% vs Jun last year best estimate incl. allocated
679.2 MMcf/d (est.) Jun 2026 gas production Jun 2026 is still filling in. The figure is the filings already in plus an estimate of the part not yet filed. The change compares this estimate with the same month last year. -24.8% vs Jun last year best estimate incl. allocated
274 Mbbl/d 2025 oil production best estimate incl. allocated
849.6 MMcf/d 2025 gas production best estimate incl. allocated
5,560 wells Producing wells tracked 12 months to Jun 2026
130.6 Mbbl/d Existing wells, Jun 2027 forecast Our forecast for existing wells.
509.2 MMcf/d Existing wells, Jun 2027 forecast Our forecast for existing wells.

Type curves

Karnes County, Texas oil type curves (bbl/d per well, log scale, against months on production; cohorts 2010–2026)
Karnes County, Texas oil type curves: average barrels per day per well on a log scale against months on production 2010-2014: 1,975 wells; starts at 261 bbl/d per well, 263 Mbbl cumulative through month 139 (100% of its wells old enough at that month); the dashed curve runs through month 199, on our forecast where a well’s own record ends2015: 521 wells; starts at 314 bbl/d per well, 235 Mbbl cumulative through month 127 (100% of its wells old enough at that month); the dashed curve runs through month 187, on our forecast where a well’s own record ends2016: 314 wells; starts at 458 bbl/d per well, 255 Mbbl cumulative through month 115 (100% of its wells old enough at that month); the dashed curve runs through month 175, on our forecast where a well’s own record ends2017: 427 wells; starts at 514 bbl/d per well, 311 Mbbl cumulative through month 103 (100% of its wells old enough at that month); the dashed curve runs through month 163, on our forecast where a well’s own record ends2018: 469 wells; starts at 516 bbl/d per well, 293 Mbbl cumulative through month 91 (100% of its wells old enough at that month); the dashed curve runs through month 151, on our forecast where a well’s own record ends2019: 427 wells; starts at 399 bbl/d per well, 252 Mbbl cumulative through month 79 (100% of its wells old enough at that month); the dashed curve runs through month 139, on our forecast where a well’s own record ends2020: 288 wells; starts at 427 bbl/d per well, 239 Mbbl cumulative through month 67 (100% of its wells old enough at that month); the dashed curve runs through month 127, on our forecast where a well’s own record ends2021: 306 wells; starts at 555 bbl/d per well, 293 Mbbl cumulative through month 55 (100% of its wells old enough at that month); the dashed curve runs through month 115, on our forecast where a well’s own record ends2022: 334 wells; starts at 469 bbl/d per well, 214 Mbbl cumulative through month 43 (100% of its wells old enough at that month); the dashed curve runs through month 103, on our forecast where a well’s own record ends2023: 284 wells; starts at 382 bbl/d per well, 177 Mbbl cumulative through month 31 (100% of its wells old enough at that month); the dashed curve runs through month 91, on our forecast where a well’s own record ends2024: 215 wells; starts at 521 bbl/d per well, 209 Mbbl cumulative through month 19 (100% of its wells old enough at that month); the dashed curve runs through month 79, on our forecast where a well’s own record ends2025: 221 wells; starts at 439 bbl/d per well, 125 Mbbl cumulative through month 7 (100% of its wells old enough at that month); the dashed curve runs through month 67, on our forecast where a well’s own record ends2026: 63 wells; starts at 192 bbl/d per well, 5.9 Mbbl cumulative through month 1 (100% of its wells old enough at that month); the dashed curve runs through month 61, on our forecast where a well’s own record ends51020501002005001,000bbl/d24487296120144168192216Months on production
Karnes County, Texas natural gas type curves (Mcf/d per well, log scale, against months on production; cohorts 2010–2026)
Karnes County, Texas natural gas type curves: average thousand cubic feet per day per well on a log scale against months on production 2010-2014: 1,975 wells; starts at 440 Mcf/d per well, 0.6 Bcf cumulative through month 139 (100% of its wells old enough at that month); the dashed curve runs through month 199, on our forecast where a well’s own record ends2015: 521 wells; starts at 683 Mcf/d per well, 0.7 Bcf cumulative through month 127 (100% of its wells old enough at that month); the dashed curve runs through month 187, on our forecast where a well’s own record ends2016: 314 wells; starts at 861 Mcf/d per well, 0.7 Bcf cumulative through month 115 (100% of its wells old enough at that month); the dashed curve runs through month 175, on our forecast where a well’s own record ends2017: 427 wells; starts at 946 Mcf/d per well, 0.9 Bcf cumulative through month 103 (100% of its wells old enough at that month); the dashed curve runs through month 163, on our forecast where a well’s own record ends2018: 469 wells; starts at 965 Mcf/d per well, 0.9 Bcf cumulative through month 91 (100% of its wells old enough at that month); the dashed curve runs through month 151, on our forecast where a well’s own record ends2019: 427 wells; starts at 870 Mcf/d per well, 0.8 Bcf cumulative through month 79 (100% of its wells old enough at that month); the dashed curve runs through month 139, on our forecast where a well’s own record ends2020: 288 wells; starts at 600 Mcf/d per well, 0.6 Bcf cumulative through month 67 (100% of its wells old enough at that month); the dashed curve runs through month 127, on our forecast where a well’s own record ends2021: 306 wells; starts at 772 Mcf/d per well, 0.7 Bcf cumulative through month 55 (100% of its wells old enough at that month); the dashed curve runs through month 115, on our forecast where a well’s own record ends2022: 334 wells; starts at 857 Mcf/d per well, 0.6 Bcf cumulative through month 43 (100% of its wells old enough at that month); the dashed curve runs through month 103, on our forecast where a well’s own record ends2023: 284 wells; starts at 1,040 Mcf/d per well, 0.7 Bcf cumulative through month 31 (100% of its wells old enough at that month); the dashed curve runs through month 91, on our forecast where a well’s own record ends2024: 215 wells; starts at 1,113 Mcf/d per well, 0.7 Bcf cumulative through month 19 (100% of its wells old enough at that month); the dashed curve runs through month 79, on our forecast where a well’s own record ends2025: 221 wells; starts at 707 Mcf/d per well, 0.3 Bcf cumulative through month 7 (100% of its wells old enough at that month); the dashed curve runs through month 67, on our forecast where a well’s own record ends2026: 63 wells; starts at 937 Mcf/d per well, 0.0 Bcf cumulative through month 1 (100% of its wells old enough at that month); the dashed curve runs through month 61, on our forecast where a well’s own record ends151001,00010,00015,000Mcf/d24487296120144168192216Months on production

best estimate incl. allocated

Horizontal wells only. Average production per well, for wells grouped by when they first produced.

How these curves are built

Horizontal wells only: 5,844 of the 5,895 wells in these cohorts. Average daily production per well, drawn against the cohort’s cumulative production per well on a log rate scale, for wells grouped by when they first produced. Includes every well of the cohort that is old enough at each month. Wells that are shut in or have stopped producing count as zero, so the average reflects the full cohort, not just survivors. Rates are calendar-day (volume ÷ days in month). The cumulative axis accumulates those same monthly averages at the average month length. Months not yet fully reported are excluded. The 2010-2014 curve draws those years as one group. The chart opens on average daily rate against months on production; the view control switches to rate against cumulative production per well (the log-rate form described above) or to cumulative production per well against months. Every view draws the same cohorts from the same production history. Each cohort is solid through the last month all of its wells sit inside fully reported data. Past it the dashed curve carries the same wells forward, on our forecast where a well’s own record ends, for up to five years. A dashed curve runs as far as at least nine in ten of its wells are accounted for. A well that is old enough but shut in still counts, as zero. The measured months are what these wells reported. In the forward months each well counts its own reported figure for each month it has one, our forecast for each month it has only that, and zero for the rest. The forward average counts every well of the cohort. The drawn forecast runs up to five years past the measured months. Line thickness tracks the size of each cohort. 26 wells are counted here but not shown on the age axis: they started producing in 1995 or earlier, too close to the start of our records for their region to verify their true age.

Cohort summary table
First produced Wells Peak oil (bbl/d per well) Month-12 oil (bbl/d per well) Cum oil in series (Mbbl per well) Peak gas (Mcf/d per well) Month-12 gas (Mcf/d per well) Cum gas in series (Bcf per well) Months in series Wells old enough at last month in series Forecast months drawn
2026 63 192 5.9 937 0.0 1 100% 60
2025 221 923 125 1,742 0.3 7 100% 60
2024 215 899 220 209 2,393 954 0.7 19 100% 60
2023 284 696 161 177 1,984 667 0.7 31 100% 60
2022 334 749 165 214 1,682 556 0.6 43 100% 60
2021 306 909 218 293 1,611 594 0.7 55 100% 60
2020 288 567 217 239 1,026 501 0.6 67 100% 60
2019 427 666 194 252 1,570 618 0.8 79 100% 60
2018 469 818 202 293 1,686 601 0.9 91 100% 60
2017 427 803 244 311 1,725 667 0.9 103 100% 60
2016 314 670 189 255 1,532 526 0.7 115 100% 60
2015 521 531 160 235 1,249 498 0.7 127 100% 60
2010-2014 1,975 466 198 263 903 444 0.6 139 100% 60

Source: CommoVision (commovision.com)

Source: CommoVision · Karnes County, Texas type curves, per-well production by first-production cohort.

Top operators in Karnes County, Texas, 2025 best estimate incl. allocated

  1. ConocoPhillips 50.1%
  2. EOG Resources 14.6%
  3. Devon Energy 12.1%
  4. Murphy Oil Corporation 5.3%
  5. BP 4.9%
  6. Repsol S.A. 3.9%
  7. Magnolia Oil & Gas 3.3%
  8. GulfTex Energy 1.6%
  9. Verdun Oil & Gas 0.8%
  10. 1776 Energy Operators 0.8%
  11. 40 other operators 2.7%
Top operators in Karnes County, Texas, 2025: full table
OperatorOil (Mbbl/d, 2025)Gas produced (MMcf/d, 2025)Share of output
ConocoPhillips 135.5450.850.1%
EOG Resources 42.092.314.6%
Devon Energy 33.694.512.1%
Murphy Oil Corporation 15.724.45.3%
BP 14.525.54.9%
Repsol S.A. 7.677.93.9%
Magnolia Oil & Gas 8.930.23.3%
GulfTex Energy 4.611.61.6%
Verdun Oil & Gas 2.45.00.8%
1776 Energy Operators 2.19.30.8%
40 other operators 7.228.12.7%

Mbbl/d = thousand barrels per day · MMcf/d = million cubic feet per day (units).

Source: CommoVision (commovision.com)

What we cover here

Each row names the grain a region’s production is held at. Where a source publishes at a coarser grain, the page says so.

DataGrainSinceBenchmark
Texas production well 1993-01 ~99–100% of EIA

Benchmark cells compare our series with the EIA’s published estimates.

About the EIA comparison

The two are produced differently: the EIA estimates from a survey of the largest operators and a model built to anticipate late filings, while the series compared here are rebuilt from the source’s own records as they arrive. Recent months can differ without either being wrong; the methodology page explains both methods.

Coverage rows for Karnes County, Texas are regenerated at every build from the same catalog of sources the data is built from.

What the data shows

  • Karnes County, Texas produced 100.0 MMbbl of oil and 310.1 Bcf of natural gas in 2025.
  • Karnes County, Texas oil production peaked in 2018 at 127.2 MMbbl; 2025 output of 100.0 MMbbl ran at 79% of that peak.
  • 5,560 producing wells tracked, 12 months to Jun 2026.

Get early access

Watch supply move as soon as its sources publish, with forecasts on 1.1+ million producing wells. The portal, an API and MCP access for AI tools open on October 1, 2026.

Data use is subject to our Terms of Service.