CommoVision

See the future in real time

Kearny County, Kansas

Kearny County, Kansas produced 365 Mbbl (thousand barrels) of oil and 13.5 Bcf of natural gas in 2025. 1,665 producing wells tracked, 12 months to May 2026.

  • Third-largest gas-producing county in Kansas, 2025.
  • 11.2% of the natural gas produced in Kansas, 2025.
  • Natural gas production fell 6% in 2025 from 2024.
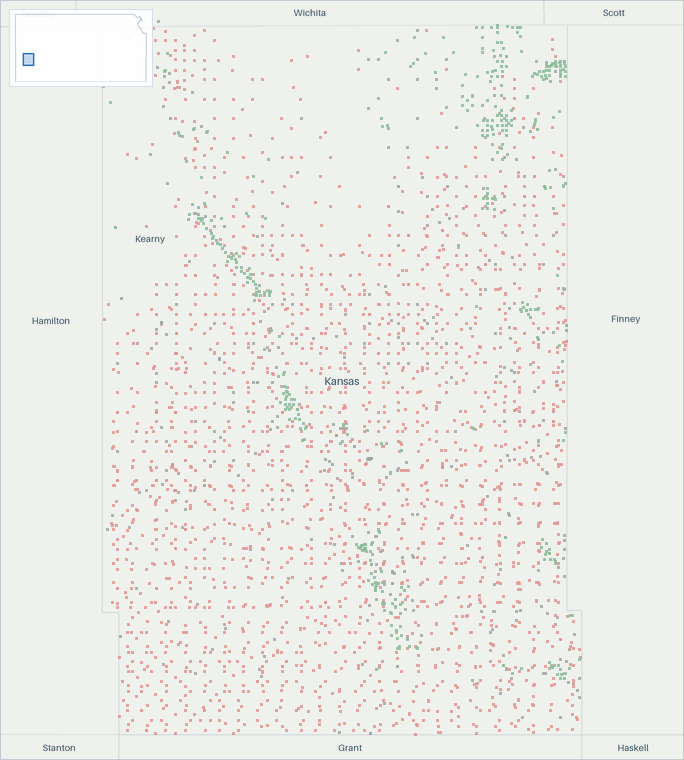
Well map of Kearny County, Kansas. The full map is further down this page.

Production

Kearny County, Kansas natural gas production (MMcf/d, grouped by when each well first produced)
  • filling in (est. · missed) . Hatching marks our estimate of the volume still to be filed. That estimate draws on our own production forecast. A check on the forecast behind this estimate measured a miss. It updates as filings arrive
  • estimated . Hatching marks our estimate. In the most recent months that is volume still to be filed. Past the divider it is our estimate of each whole month, built on any filings already in. Beyond the last filings it is our forecast.
Kearny County, Kansas natural gas production: million cubic feet per day, by first-production vintage filed in full 20406080 MMcf/d 2017201820192020202120222023202420252026 Oct 2016: 63 MMcf/d total Nov 2016: 58.1 MMcf/d total Dec 2016: 56.8 MMcf/d total Jan 2017: 55.5 MMcf/d total Feb 2017: 56.5 MMcf/d total Mar 2017: 56.3 MMcf/d total Apr 2017: 55.7 MMcf/d total May 2017: 54.9 MMcf/d total Jun 2017: 57.5 MMcf/d total Jul 2017: 57.2 MMcf/d total Aug 2017: 56.5 MMcf/d total Sep 2017: 56.5 MMcf/d total Oct 2017: 55.4 MMcf/d total Nov 2017: 55.1 MMcf/d total Dec 2017: 53.8 MMcf/d total Jan 2018: 53.1 MMcf/d total Feb 2018: 54.2 MMcf/d total Mar 2018: 53.2 MMcf/d total Apr 2018: 53.4 MMcf/d total May 2018: 52.9 MMcf/d total Jun 2018: 47.4 MMcf/d total Jul 2018: 53.2 MMcf/d total Aug 2018: 51.8 MMcf/d total Sep 2018: 54.2 MMcf/d total Oct 2018: 52.6 MMcf/d total Nov 2018: 52.1 MMcf/d total Dec 2018: 47.9 MMcf/d total Jan 2019: 49.8 MMcf/d total Feb 2019: 49.1 MMcf/d total Mar 2019: 48.8 MMcf/d total Apr 2019: 50.3 MMcf/d total May 2019: 46.3 MMcf/d total Jun 2019: 52.5 MMcf/d total Jul 2019: 49.9 MMcf/d total Aug 2019: 50.2 MMcf/d total Sep 2019: 51.3 MMcf/d total Oct 2019: 46.8 MMcf/d total Nov 2019: 47.5 MMcf/d total Dec 2019: 49.7 MMcf/d total Jan 2020: 48.1 MMcf/d total Feb 2020: 47.8 MMcf/d total Mar 2020: 47.6 MMcf/d total Apr 2020: 47.5 MMcf/d total May 2020: 48.3 MMcf/d total Jun 2020: 47.6 MMcf/d total Jul 2020: 47.7 MMcf/d total Aug 2020: 47.8 MMcf/d total Sep 2020: 46.8 MMcf/d total Oct 2020: 46.9 MMcf/d total Nov 2020: 45.5 MMcf/d total Dec 2020: 45.3 MMcf/d total Jan 2021: 44 MMcf/d total Feb 2021: 38.9 MMcf/d total Mar 2021: 44.8 MMcf/d total Apr 2021: 44.5 MMcf/d total May 2021: 44.3 MMcf/d total Jun 2021: 45.5 MMcf/d total Jul 2021: 45.7 MMcf/d total Aug 2021: 46.1 MMcf/d total Sep 2021: 46.2 MMcf/d total Oct 2021: 45.7 MMcf/d total Nov 2021: 45.3 MMcf/d total Dec 2021: 44.5 MMcf/d total Jan 2022: 43.6 MMcf/d total Feb 2022: 42.5 MMcf/d total Mar 2022: 42.3 MMcf/d total Apr 2022: 43.8 MMcf/d total May 2022: 44.4 MMcf/d total Jun 2022: 44.2 MMcf/d total Jul 2022: 43.9 MMcf/d total Aug 2022: 44.7 MMcf/d total Sep 2022: 42.4 MMcf/d total Oct 2022: 44.2 MMcf/d total Nov 2022: 42.7 MMcf/d total Dec 2022: 40.4 MMcf/d total Jan 2023: 40.2 MMcf/d total Feb 2023: 40.8 MMcf/d total Mar 2023: 40.9 MMcf/d total Apr 2023: 41.6 MMcf/d total May 2023: 41.6 MMcf/d total Jun 2023: 39.8 MMcf/d total Jul 2023: 41.1 MMcf/d total Aug 2023: 41.2 MMcf/d total Sep 2023: 41.5 MMcf/d total Oct 2023: 41.8 MMcf/d total Nov 2023: 41.4 MMcf/d total Dec 2023: 40.9 MMcf/d total Jan 2024: 36.7 MMcf/d total Feb 2024: 40 MMcf/d total Mar 2024: 39.8 MMcf/d total Apr 2024: 39.6 MMcf/d total May 2024: 39.5 MMcf/d total Jun 2024: 39.9 MMcf/d total Jul 2024: 39.5 MMcf/d total Aug 2024: 38.6 MMcf/d total Sep 2024: 39.1 MMcf/d total Oct 2024: 38.5 MMcf/d total Nov 2024: 39.3 MMcf/d total Dec 2024: 38.6 MMcf/d total Jan 2025: 36.5 MMcf/d total Feb 2025: 34.7 MMcf/d total Mar 2025: 37.4 MMcf/d total Apr 2025: 35.7 MMcf/d total May 2025: 38.3 MMcf/d total Jun 2025: 36.8 MMcf/d total Jul 2025: 38.4 MMcf/d total Aug 2025: 37.8 MMcf/d total Sep 2025: 37.1 MMcf/d total Oct 2025: 37.9 MMcf/d total Nov 2025: 36.1 MMcf/d total Dec 2025: 35.6 MMcf/d total Jan 2026: 33.2 MMcf/d total Feb 2026: 35.8 MMcf/d total Mar 2026: 35.2 MMcf/d total Apr 2026: ≈35.3 MMcf/d total (97% arrived, remainder estimated) May 2026: ≈34 MMcf/d total (95% arrived, remainder estimated) Jun 2026: ≈35.4 MMcf/d total (<1% arrived, remainder estimated) Jul 2026: ≈35.4 MMcf/d total (<1% arrived, remainder estimated) Aug 2026: ≈35.4 MMcf/d total (<1% arrived, remainder estimated) Sep 2026: ≈35.3 MMcf/d total (<1% arrived, remainder estimated)

In this view, hatching marks our estimate, and in the most recent months that is volume still to be filed. Past the divider, the chart continues only the bands it has drawn. Each band continues as our estimate, from any filings already in and then from our forecast, built by summing our per-well forecasts. The method behind each well is recorded with the forecast. The forward months cover existing wells only. How our methods work

All from what the source published. All held at well grain.

How the volume breaks down
  • 98.3% Reported by the official source by well
  • 1.7% Reported by the official source as a lease total, split across the lease's wells. The regional total shown is the reported number, to rounding.

Every cubic foot through March 2026 starts from what the official source published for those months. Measured over January 1987 to March 2026.

Kearny County, Kansas oil production (Mbbl/d, grouped by when each well first produced)
Kearny County, Kansas oil production: thousand barrels per day, by first-production vintage today 0.511.5 Mbbl/d 2017201820192020202120222023202420252026 Jun 2016: 1.03 Mbbl/d total Jul 2016: 0.94 Mbbl/d total Aug 2016: 0.95 Mbbl/d total Sep 2016: 0.91 Mbbl/d total Oct 2016: 0.91 Mbbl/d total Nov 2016: 1.01 Mbbl/d total Dec 2016: 0.83 Mbbl/d total Jan 2017: 0.97 Mbbl/d total Feb 2017: 0.98 Mbbl/d total Mar 2017: 0.88 Mbbl/d total Apr 2017: 0.9 Mbbl/d total May 2017: 0.81 Mbbl/d total Jun 2017: 1.01 Mbbl/d total Jul 2017: 1 Mbbl/d total Aug 2017: 1.04 Mbbl/d total Sep 2017: 0.96 Mbbl/d total Oct 2017: 0.9 Mbbl/d total Nov 2017: 0.94 Mbbl/d total Dec 2017: 0.86 Mbbl/d total Jan 2018: 0.85 Mbbl/d total Feb 2018: 0.97 Mbbl/d total Mar 2018: 1 Mbbl/d total Apr 2018: 0.9 Mbbl/d total May 2018: 1.07 Mbbl/d total Jun 2018: 0.91 Mbbl/d total Jul 2018: 0.94 Mbbl/d total Aug 2018: 0.94 Mbbl/d total Sep 2018: 0.94 Mbbl/d total Oct 2018: 0.84 Mbbl/d total Nov 2018: 0.88 Mbbl/d total Dec 2018: 0.79 Mbbl/d total Jan 2019: 0.79 Mbbl/d total Feb 2019: 0.88 Mbbl/d total Mar 2019: 0.88 Mbbl/d total Apr 2019: 0.79 Mbbl/d total May 2019: 0.87 Mbbl/d total Jun 2019: 0.89 Mbbl/d total Jul 2019: 0.9 Mbbl/d total Aug 2019: 0.86 Mbbl/d total Sep 2019: 0.84 Mbbl/d total Oct 2019: 0.81 Mbbl/d total Nov 2019: 0.85 Mbbl/d total Dec 2019: 0.84 Mbbl/d total Jan 2020: 0.79 Mbbl/d total Feb 2020: 0.76 Mbbl/d total Mar 2020: 0.85 Mbbl/d total Apr 2020: 0.93 Mbbl/d total May 2020: 0.89 Mbbl/d total Jun 2020: 1 Mbbl/d total Jul 2020: 0.98 Mbbl/d total Aug 2020: 1.08 Mbbl/d total Sep 2020: 0.88 Mbbl/d total Oct 2020: 0.89 Mbbl/d total Nov 2020: 0.93 Mbbl/d total Dec 2020: 1.01 Mbbl/d total Jan 2021: 0.96 Mbbl/d total Feb 2021: 0.72 Mbbl/d total Mar 2021: 0.98 Mbbl/d total Apr 2021: 0.97 Mbbl/d total May 2021: 1.13 Mbbl/d total Jun 2021: 1.24 Mbbl/d total Jul 2021: 1.29 Mbbl/d total Aug 2021: 1.22 Mbbl/d total Sep 2021: 1.24 Mbbl/d total Oct 2021: 1.28 Mbbl/d total Nov 2021: 1.22 Mbbl/d total Dec 2021: 1.2 Mbbl/d total Jan 2022: 1.12 Mbbl/d total Feb 2022: 1.27 Mbbl/d total Mar 2022: 1.17 Mbbl/d total Apr 2022: 1.09 Mbbl/d total May 2022: 1.13 Mbbl/d total Jun 2022: 1.13 Mbbl/d total Jul 2022: 1.05 Mbbl/d total Aug 2022: 1.08 Mbbl/d total Sep 2022: 1.05 Mbbl/d total Oct 2022: 1.03 Mbbl/d total Nov 2022: 0.93 Mbbl/d total Dec 2022: 0.91 Mbbl/d total Jan 2023: 0.96 Mbbl/d total Feb 2023: 1.35 Mbbl/d total Mar 2023: 1.27 Mbbl/d total Apr 2023: 1.17 Mbbl/d total May 2023: 1.16 Mbbl/d total Jun 2023: 1.08 Mbbl/d total Jul 2023: 1.1 Mbbl/d total Aug 2023: 1.07 Mbbl/d total Sep 2023: 1.14 Mbbl/d total Oct 2023: 1.22 Mbbl/d total Nov 2023: 1.15 Mbbl/d total Dec 2023: 1.18 Mbbl/d total Jan 2024: 0.91 Mbbl/d total Feb 2024: 1.21 Mbbl/d total Mar 2024: 1.19 Mbbl/d total Apr 2024: 1.17 Mbbl/d total May 2024: 1.07 Mbbl/d total Jun 2024: 1.06 Mbbl/d total Jul 2024: 1.09 Mbbl/d total Aug 2024: 1.05 Mbbl/d total Sep 2024: 1.12 Mbbl/d total Oct 2024: 1.16 Mbbl/d total Nov 2024: 1.04 Mbbl/d total Dec 2024: 1.06 Mbbl/d total Jan 2025: 0.94 Mbbl/d total Feb 2025: 0.93 Mbbl/d total Mar 2025: 1.01 Mbbl/d total Apr 2025: 1.09 Mbbl/d total May 2025: 1.01 Mbbl/d total Jun 2025: 1.07 Mbbl/d total Jul 2025: 1.06 Mbbl/d total Aug 2025: 0.98 Mbbl/d total Sep 2025: 1.01 Mbbl/d total Oct 2025: 0.96 Mbbl/d total Nov 2025: 0.99 Mbbl/d total Dec 2025: 0.94 Mbbl/d total Jan 2026: 0.98 Mbbl/d total Feb 2026: 0.93 Mbbl/d total Mar 2026: 0.98 Mbbl/d total Apr 2026: 0.96 Mbbl/d total May 2026: 0.93 Mbbl/d total

Still arriving: Jun 2026 <1% filed, Jul 2026 <1% filed, Aug 2026 <1% filed.

All from what the source published. All held at well grain.

How the volume breaks down
  • 58.8% Reported by the official source by well
  • 41.2% Reported by the official source as a lease total, split across the lease's wells. The regional total shown is the reported number, to rounding.

Every barrel through March 2026 starts from what the official source published for those months. Measured over January 1987 to March 2026.

The bands group wells by when they first produced.

About this chart

The stack shows what is holding today's rate up and how much of it is new drilling. In the reported months the bands draw the filings already in. The months still filling in are marked.

Annual table (full history)
YearOil (MMbbl)Gas produced (Bcf)
20250.413
20240.414
20230.415
20220.416
20210.416
20200.317
20190.318
20180.319
20170.320
20160.422
20150.424
20140.425
20130.425
20120.327
20110.228
20100.331
20090.333
20080.235
20070.236
20060.239
20050.243
20040.248
20030.252
20020.256
20010.260
20000.364
19990.369
19980.375
19970.385
19960.391
19950.495
19940.488
19930.487
19920.583
19910.685
19900.457
19890.471
19880.372
19870.363

Source: CommoVision (commovision.com)

Monthly table (last 24 months)
MonthOil (Mbbl)Gas produced (MMcf)
2026-0528.91,030
2026-0428.71,044
2026-0330.31,093
2026-0226.11,001
2026-0130.41,030
2025-1229.01,103
2025-1129.71,082
2025-1029.91,174
2025-0930.41,113
2025-0830.51,171
2025-0732.81,191
2025-0632.21,105
2025-0531.21,186
2025-0432.61,070
2025-0331.41,160
2025-0226.1973
2025-0129.31,132
2024-1232.81,197
2024-1131.11,179
2024-1036.01,194
2024-0933.51,173
2024-0832.41,196
2024-0733.91,224
2024-0631.81,198

Source: CommoVision (commovision.com)

Source: CommoVision · Kearny County, Kansas, data through May 2026.

Well map

A map of 2,959 well locations in Kearny County, Kansas for which CommoVision holds a published surface coordinate, each drawn where it is and colored by its primary product (green for oil, red for natural gas, gray where undetermined; a spot shared by more than one product shows the one with the most wells there), on a ground of land and water over faint county outlines and place names for orientation, with a small inset map locating this frame in Kansas.
  • Oil 361
  • Natural gas 2,110
  • Undetermined 488
2,959 well locations in Kearny County, Kansas, colored by primary product.
About this map

Undetermined means not enough signal to settle it. Producing wells are the ones that reported oil or gas in the 12 months to May 2026.

0.9 Mbbl/d May 2026 oil production -7.5% vs May last year
34 MMcf/d (est.) May 2026 gas production May 2026 is still filling in. The figure is the filings already in plus an estimate of the part not yet filed. The change compares this estimate with the same month last year. -11.1% vs May last year
1 Mbbl/d 2025 oil production
36.9 MMcf/d 2025 gas production
1,665 wells Producing wells tracked 12 months to May 2026
33.5 MMcf/d Existing wells, Sep 2027 forecast Our forecast for existing wells.

Top operators in Kearny County, Kansas, 2025

  1. Scout Energy Management 59.5%
  2. Merit Energy Company 12.2%
  3. Berexco 10.4%
  4. Casillas Petroleum Corp. 5.0%
  5. American Warrior Inc. 3.3%
  6. Kansas Natural Gas Operating, Lc 1.5%
  7. Abercrombie Energy, LLC 1.2%
  8. Petroleum Development 1.0%
  9. Oil Producers Inc Of Kansas 0.9%
  10. Zenith Drilling Corporation 0.8%
  11. 24 other operators 4.3%
Top operators in Kearny County, Kansas, 2025: full table
OperatorOil (Mbbl/d, 2025)Gas produced (MMcf/d, 2025)Share of output
Scout Energy Management 0.030.959.5%
Merit Energy Company 0.31.412.2%
Berexco 0.40.010.4%
Casillas Petroleum Corp. 0.02.25.0%
American Warrior Inc. 0.10.03.3%
Kansas Natural Gas Operating, Lc 0.00.81.5%
Abercrombie Energy, LLC 0.00.01.2%
Petroleum Development 0.00.11.0%
Oil Producers Inc Of Kansas 0.00.00.9%
Zenith Drilling Corporation 0.00.00.8%
24 other operators 0.01.54.3%

Mbbl/d = thousand barrels per day · MMcf/d = million cubic feet per day (units).

Source: CommoVision (commovision.com)

What we cover here

Each row names the grain a region’s production is held at. Where a source publishes at a coarser grain, the page says so.

DataGrainSinceBenchmark
Kansas production well 1987-01 ~99–100% of EIA

Benchmark cells compare our series with the EIA’s published estimates.

About the EIA comparison

The two are produced differently: the EIA estimates from a survey of the largest operators and a model built to anticipate late filings, while the series compared here are rebuilt from the source’s own records as they arrive. Recent months can differ without either being wrong; the methodology page explains both methods.

Coverage rows for Kearny County, Kansas are regenerated at every build from the same catalog of sources the data is built from.

What the data shows

  • Kearny County, Kansas produced 365 Mbbl (thousand barrels) of oil and 13.5 Bcf of natural gas in 2025.
  • Kearny County, Kansas gas production peaked in 1995 at 95.3 Bcf; 2025 output of 13.5 Bcf ran at 14% of that peak.
  • 1,665 producing wells tracked, 12 months to May 2026.

Get early access

Watch supply move as soon as its sources publish, with forecasts on 1.1+ million producing wells. The portal, an API and MCP access for AI tools open on October 1, 2026.

Data use is subject to our Terms of Service.