
Custer County, Oklahoma
Custer County, Oklahoma produced 3.6 MMbbl of oil and 110.9 Bcf of natural gas in 2025. 1,097 producing wells tracked, 12 months to Jul 2026.
- Eighth-largest gas-producing county in Oklahoma, 2025.
- 4.1% of the natural gas produced in Oklahoma, 2025.
- Natural gas production rose 8% in 2025 from 2024.
Production
- filling in (est. · missed) . Hatching marks our estimate of the volume still to be filed. That estimate draws on our own production forecast. A check on the forecast behind this estimate measured a miss. It updates as filings arrive
Still arriving: Sep 2026 <1% filed.
All from what the source published. All held at well grain.
How the volume breaks down
- 54.8% Reported by the official source by well
- 45.2% Reported by the official source as a lease total, split across the lease's wells. The regional total shown is the reported number, to rounding.
Every cubic foot through July 2026 starts from what the official source published for those months. Measured over January 1990 to July 2026.
- filling in (est. · missed) . Hatching marks our estimate of the volume still to be filed. That estimate draws on our own production forecast. A check on the forecast behind this estimate measured a miss. It updates as filings arrive
- estimated . Hatching marks our estimate. In the most recent months that is volume still to be filed. Past the divider it is our estimate of each whole month, built on any filings already in. Beyond the last filings it is our forecast.
In this view, hatching marks our estimate, and in the most recent months that is volume still to be filed. Past the divider, the chart continues only the bands it has drawn. Each band continues as our estimate, from any filings already in and then from our forecast, built by summing our per-well forecasts. The method behind each well is recorded with the forecast. The forward months cover existing wells only. How our methods work
All from what the source published. All held at well grain.
How the volume breaks down
- 56.9% Reported by the official source by well
- 43.1% Reported by the official source as a lease total, split across the lease's wells. The regional total shown is the reported number, to rounding.
Every barrel through July 2026 starts from what the official source published for those months. Measured over January 1990 to July 2026.
The bands group wells by when they first produced.
About this chart
The stack shows what is holding today's rate up and how much of it is new drilling. In the reported months the bands draw the filings already in. The months still filling in are marked.
Annual table (full history)
best estimate incl. allocated
| Year | Oil (MMbbl) | Gas produced (Bcf) |
|---|---|---|
| 2025 | 3.6 | 111 |
| 2024 | 1.8 | 103 |
| 2023 | 1.1 | 120 |
| 2022 | 1.2 | 98 |
| 2021 | 1.2 | 94 |
| 2020 | 1.3 | 104 |
| 2019 | 1.8 | 128 |
| 2018 | 1.2 | 108 |
| 2017 | 1.1 | 70 |
| 2016 | 0.9 | 40 |
| 2015 | 0.9 | 30 |
| 2014 | 1.0 | 31 |
| 2013 | 0.7 | 37 |
| 2012 | 0.6 | 38 |
| 2011 | 0.8 | 43 |
| 2010 | 0.6 | 49 |
| 2009 | 0.6 | 51 |
| 2008 | 0.7 | 57 |
| 2007 | 0.6 | 58 |
| 2006 | 0.6 | 63 |
| 2005 | 0.6 | 64 |
| 2004 | 0.6 | 67 |
| 2003 | 0.7 | 69 |
| 2002 | 0.6 | 67 |
| 2001 | 0.4 | 70 |
| 2000 | 0.5 | 73 |
| 1999 | 0.2 | 74 |
| 1998 | 0.2 | 74 |
| 1997 | 0.1 | 79 |
| 1996 | 0.1 | 80 |
| 1995 | 0.1 | 84 |
| 1994 | 0.1 | 100 |
| 1993 | 0.2 | 110 |
| 1992 | 0.2 | 94 |
| 1991 | 0.1 | 102 |
| 1990 | 0.1 | 56 |
Source: CommoVision (commovision.com)
Monthly table (last 24 months)
| Month | Oil (Mbbl) | Gas produced (MMcf) |
|---|---|---|
| 2026-07 | 521.7 | 14,000 |
| 2026-06 | 468.3 | 14,108 |
| 2026-05 | 400.5 | 14,883 |
| 2026-04 | 399.8 | 15,634 |
| 2026-03 | 450.5 | 17,330 |
| 2026-02 | 437.8 | 15,570 |
| 2026-01 | 524.6 | 19,171 |
| 2025-12 | 456.1 | 18,088 |
| 2025-11 | 367.4 | 11,465 |
| 2025-10 | 382.3 | 9,365 |
| 2025-09 | 424.2 | 7,930 |
| 2025-08 | 311.9 | 8,025 |
| 2025-07 | 254.3 | 7,992 |
| 2025-06 | 238.0 | 7,743 |
| 2025-05 | 249.6 | 8,014 |
| 2025-04 | 236.6 | 7,920 |
| 2025-03 | 239.4 | 8,401 |
| 2025-02 | 226.6 | 7,503 |
| 2025-01 | 216.1 | 8,486 |
| 2024-12 | 188.2 | 8,496 |
| 2024-11 | 136.0 | 7,609 |
| 2024-10 | 161.3 | 7,959 |
| 2024-09 | 164.9 | 7,851 |
| 2024-08 | 197.0 | 8,393 |
Source: CommoVision (commovision.com)
Source: CommoVision · Custer County, Oklahoma, data through August 2026.
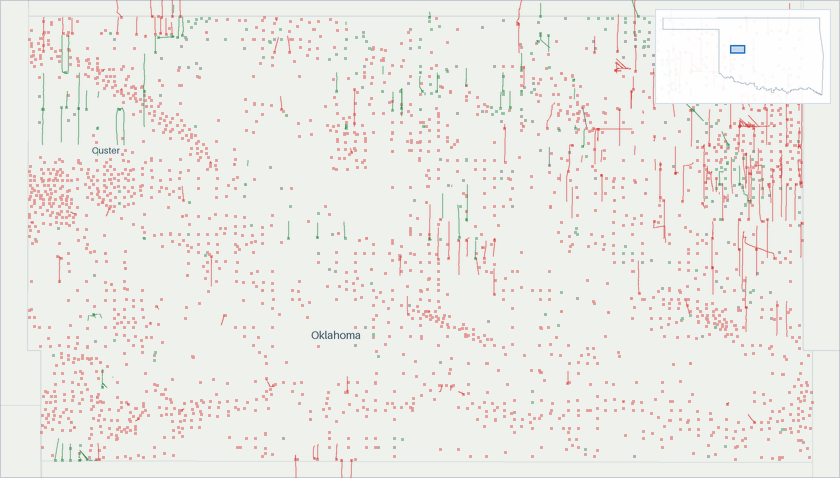
Well map
- Oil 232
- Natural gas 2,251
- Undetermined 223
About this map
Undetermined means not enough signal to settle it. Producing wells are the ones that reported oil or gas in the 12 months to Jul 2026.
Type curves
best estimate incl. allocated
Horizontal wells only. Average production per well, for wells grouped by when they first produced.
How these curves are built
Horizontal wells only: 270 of the 310 wells in these cohorts. Average daily production per well, for wells grouped by when they first produced. Includes every well of the cohort that is old enough at each month. Wells that are shut in or have stopped producing count as zero, so the average reflects the full cohort, not just survivors. Rates are calendar-day (volume ÷ days in month). The cumulative axis accumulates those same monthly averages at the average month length. Months not yet fully reported are excluded. The 2010-2014 curve draws those years as one group. The chart opens on average daily rate against months on production, the rate on a log scale. The view control switches to rate against cumulative production per well, on the same log rate scale, or to cumulative production per well against months on production, on a linear scale. Every view draws the same cohorts from the same production history. Each cohort is solid through the last month all the wells in its curve sit inside fully reported data. Past it the dashed curve carries the same wells forward, on our forecast where a well’s own record ends, for up to five years. A dashed curve runs as far as at least nine in ten of its wells are accounted for. A well that is old enough but shut in still counts, as zero. The measured months are what these wells reported. In the forward months each well counts its own reported figure for each month it has one, our forecast for each month it has only that, and zero for the rest. The forward average counts every well in the curve. The drawn forecast runs up to five years past the measured months. Line thickness tracks the size of each cohort.
Cohort summary table
| First produced | Wells in curve | Peak oil (bbl/d per well) | Month-12 oil (bbl/d per well) | Cum oil in series (Mbbl per well) | Peak gas (Mcf/d per well) | Month-12 gas (Mcf/d per well) | Cum gas in series (Bcf per well) | Months in series | Wells old enough at last month in series | Forecast months drawn |
|---|---|---|---|---|---|---|---|---|---|---|
| 2026 | 4 | 467 | — | 23.3 | 2,497 | — | 0.1 | 2 | 100% | 60 |
| 2025 | 48 | 449 | — | 62.0 | 8,777 | — | 1.6 | 8 | 100% | 60 |
| 2024 | 12 | 482 | 170 | 118 | 4,130 | 1,962 | 1.4 | 20 | 100% | 60 |
| 2023 | 13 | 218 | 77.8 | 83.9 | 8,925 | 5,563 | 4.8 | 32 | 100% | 60 |
| 2022 | 8 | 163 | 52.4 | 55.7 | 5,766 | 5,653 | 4.2 | 48 | 100% | 60 |
| 2021 | 7 | 258 | 73.5 | 96.6 | 8,849 | 5,082 | 5.7 | 56 | 100% | 60 |
| 2020 | 8 | 47.2 | 18.4 | 23.0 | 6,447 | 3,753 | 5.2 | 70 | 100% | 60 |
| 2019 | 27 | 189 | 55.9 | 99.2 | 5,454 | 3,218 | 4.5 | 81 | 100% | 60 |
| 2018 | 33 | 74.2 | 20.8 | 29.0 | 7,874 | 4,379 | 6.1 | 92 | 100% | 60 |
| 2017 | 20 | 85 | 26.8 | 41.1 | 8,414 | 4,453 | 6.8 | 104 | 100% | 60 |
| 2016 | 12 | 71.2 | 16 | 22.2 | 6,912 | 3,051 | 4.6 | 116 | 100% | 60 |
| 2015 | 13 | 118 | 60.8 | 118 | 2,296 | 1,276 | 2.0 | 128 | 100% | 60 |
| 2010-2014 | 65 | 104 | 26.2 | 41.4 | 819 | 282 | 0.5 | 140 | 100% | 60 |
Source: CommoVision (commovision.com)
Source: CommoVision · Custer County, Oklahoma type curves, per-well production by first-production cohort.
Top operators in Custer County, Oklahoma, 2025 best estimate incl. allocated
Top operators in Custer County, Oklahoma, 2025: full table
| Operator | Oil (Mbbl/d, 2025) | Gas produced (MMcf/d, 2025) | Share of output |
|---|---|---|---|
| Mewbourne Oil Company | 6.4 | 52.2 | 32.8% |
| Continental Resources | 0.1 | 103.4 | 23.2% |
| Validus Energy | 0.0 | 29.0 | 6.4% |
| Nadel and Gussman, LLC | 0.7 | 12.0 | 5.0% |
| Mach Natural Resources LP | 0.0 | 18.8 | 4.3% |
| Diversified Energy Company | 0.1 | 13.3 | 3.3% |
| Devon Energy | 0.6 | 3.4 | 2.9% |
| Crawley Petroleum Corporation | 0.1 | 11.6 | 2.8% |
| Unit Corporation | 0.3 | 7.2 | 2.5% |
| Mid-Con Energy Operating (March to December) | 0.0 | 11.3 | 2.2% |
| 71 other operators | 1.4 | 36.8 | 12.7% |
| Without a named operator | 0.1 | 6.8 | 1.8% |
Mbbl/d = thousand barrels per day · MMcf/d = million cubic feet per day (units).
Source: CommoVision (commovision.com)
Active drilling rigs
Interactive chart. Focus it and use the left and right arrow keys to read each week, Page Up and Page Down to move a year, Home and End for the ends of the series. The full figures are also in the table below.
- In Custer County, Oklahoma, 10 drilling rigs were active in the week to October 16, 2026 (6 more than a year earlier).
- Since Oct 2016, the weekly count peaked at 10 in May 2025.
- The count covers land and inland-water rigs; rigs in US federal offshore waters are counted on the Gulf of Mexico page.
Average active rigs per month: full table
| Month | Oil-directed | Gas-directed | All rigs |
|---|---|---|---|
| Oct 2026 (through October 16, 2026) | 9 | 0 | 9 |
| Sep 2026 | 7 | 0 | 7 |
| Aug 2026 | 7 | 0 | 7 |
| Jul 2026 | 8.8 | 0 | 8.8 |
| Jun 2026 | 8.2 | 0 | 8.2 |
| May 2026 | 8.8 | 0 | 8.8 |
| Apr 2026 | 9 | 0 | 9 |
| Mar 2026 | 6.8 | 0 | 6.8 |
| Feb 2026 | 2.2 | 0 | 2.2 |
| Jan 2026 | 3 | 0 | 3 |
| Dec 2025 | 3 | 0 | 3 |
| Nov 2025 | 3.2 | 0 | 3.2 |
| Oct 2025 | 3.8 | 0 | 3.8 |
| Sep 2025 | 5 | 0 | 5 |
| Aug 2025 | 5 | 0 | 5 |
| Jul 2025 | 3.2 | 0 | 3.2 |
| Jun 2025 | 6.2 | 0 | 6.2 |
| May 2025 | 10 | 0 | 10 |
| Apr 2025 | 6 | 0 | 6 |
| Mar 2025 | 4 | 0 | 4 |
| Feb 2025 | 3.2 | 0 | 3.2 |
| Jan 2025 | 3 | 0 | 3 |
| Dec 2024 | 3.4 | 0 | 3.4 |
| Nov 2024 | 1.5 | 0 | 1.5 |
Source: CommoVision (commovision.com)
What we cover here
Each row names the grain a region’s production is held at. Where a source publishes at a coarser grain, the page says so.
| Data | Grain | Since | Benchmark |
|---|---|---|---|
| Oklahoma production | lease + well | 1990-07 | ~99–100% of EIA |
Benchmark cells compare our series with the EIA’s published estimates.
About the EIA comparison
The two are produced differently: the EIA estimates from a survey of the largest operators and a model built to anticipate late filings, while the series compared here are rebuilt from the source’s own records as they arrive. Recent months can differ without either being wrong; the methodology page explains both methods.
Coverage rows for Custer County, Oklahoma are regenerated at every build from the same catalog of sources the data is built from.
What the data shows
- Custer County, Oklahoma produced 3.6 MMbbl of oil and 110.9 Bcf of natural gas in 2025.
- Custer County, Oklahoma gas production peaked in 2019 at 127.9 Bcf; 2025 output of 110.9 Bcf ran at 87% of that peak.
- A county page carries the production attributed to wells in that county. Oklahoma also publishes production that is held at lease grain, and that sits on the Oklahoma state page. In 2025 it was 8.4% of the state's oil and 3.0% of its gas.
- 1,097 producing wells tracked, 12 months to Jul 2026.
Start a free trial
Watch supply move as soon as its sources publish, with forecasts on 1.1+ million producing wells. The portal is open, with a real API and MCP access for AI tools.
Data use is subject to our Terms of Service.