CommoVision

See the future in real time

Tioga County, Pennsylvania

Tioga County, Pennsylvania produced 491.6 Bcf of natural gas in 2025. 923 producing wells tracked, 12 months to Aug 2026.

  • Sixth-largest gas-producing county in Pennsylvania, 2025.
  • 6.3% of the natural gas produced in Pennsylvania, 2025.
  • Natural gas production rose 14% in 2025 from 2024.
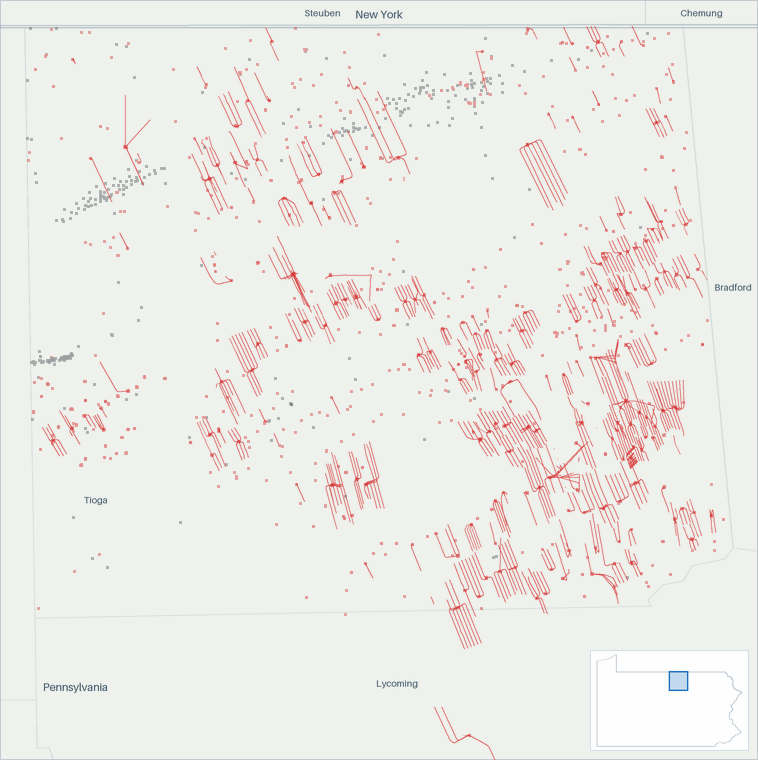
Well map of Tioga County, Pennsylvania. The full map is further down this page.

Production

Tioga County, Pennsylvania natural gas production (MMcf/d, grouped by when each well first produced)
  • filling in (est. · unconfirmed) . Hatching marks our estimate of the volume still to be filed. That estimate draws on our own production forecast. This estimate is published unconfirmed. It updates as filings arrive
  • estimated . Hatching marks our estimate. In the most recent months that is volume still to be filed. Past the divider it is our estimate of each whole month, built on any filings already in. Beyond the last filings it is our forecast.
Tioga County, Pennsylvania natural gas production: million cubic feet per day, by first-production vintage filed in full 5001,0001,500 MMcf/d 2017201820192020202120222023202420252026 Nov 2016: 567 MMcf/d total Dec 2016: 581 MMcf/d total Jan 2017: 601 MMcf/d total Feb 2017: 593 MMcf/d total Mar 2017: 571 MMcf/d total Apr 2017: 563 MMcf/d total May 2017: 549 MMcf/d total Jun 2017: 560 MMcf/d total Jul 2017: 547 MMcf/d total Aug 2017: 528 MMcf/d total Sep 2017: 586 MMcf/d total Oct 2017: 695 MMcf/d total Nov 2017: 705 MMcf/d total Dec 2017: 764 MMcf/d total Jan 2018: 758 MMcf/d total Feb 2018: 775 MMcf/d total Mar 2018: 761 MMcf/d total Apr 2018: 740 MMcf/d total May 2018: 769 MMcf/d total Jun 2018: 879 MMcf/d total Jul 2018: 910 MMcf/d total Aug 2018: 896 MMcf/d total Sep 2018: 870 MMcf/d total Oct 2018: 867 MMcf/d total Nov 2018: 842 MMcf/d total Dec 2018: 851 MMcf/d total Jan 2019: 831 MMcf/d total Feb 2019: 830 MMcf/d total Mar 2019: 862 MMcf/d total Apr 2019: 912 MMcf/d total May 2019: 937 MMcf/d total Jun 2019: 883 MMcf/d total Jul 2019: 1,017 MMcf/d total Aug 2019: 1,040 MMcf/d total Sep 2019: 1,059 MMcf/d total Oct 2019: 1,031 MMcf/d total Nov 2019: 1,047 MMcf/d total Dec 2019: 1,009 MMcf/d total Jan 2020: 945 MMcf/d total Feb 2020: 1,041 MMcf/d total Mar 2020: 1,018 MMcf/d total Apr 2020: 954 MMcf/d total May 2020: 934 MMcf/d total Jun 2020: 938 MMcf/d total Jul 2020: 956 MMcf/d total Aug 2020: 946 MMcf/d total Sep 2020: 814 MMcf/d total Oct 2020: 814 MMcf/d total Nov 2020: 863 MMcf/d total Dec 2020: 901 MMcf/d total Jan 2021: 876 MMcf/d total Feb 2021: 850 MMcf/d total Mar 2021: 823 MMcf/d total Apr 2021: 840 MMcf/d total May 2021: 807 MMcf/d total Jun 2021: 772 MMcf/d total Jul 2021: 744 MMcf/d total Aug 2021: 775 MMcf/d total Sep 2021: 755 MMcf/d total Oct 2021: 743 MMcf/d total Nov 2021: 739 MMcf/d total Dec 2021: 813 MMcf/d total Jan 2022: 779 MMcf/d total Feb 2022: 801 MMcf/d total Mar 2022: 882 MMcf/d total Apr 2022: 962 MMcf/d total May 2022: 959 MMcf/d total Jun 2022: 951 MMcf/d total Jul 2022: 982 MMcf/d total Aug 2022: 950 MMcf/d total Sep 2022: 946 MMcf/d total Oct 2022: 963 MMcf/d total Nov 2022: 1,036 MMcf/d total Dec 2022: 1,141 MMcf/d total Jan 2023: 1,132 MMcf/d total Feb 2023: 1,092 MMcf/d total Mar 2023: 1,141 MMcf/d total Apr 2023: 1,185 MMcf/d total May 2023: 1,178 MMcf/d total Jun 2023: 1,173 MMcf/d total Jul 2023: 1,191 MMcf/d total Aug 2023: 1,069 MMcf/d total Sep 2023: 1,112 MMcf/d total Oct 2023: 1,163 MMcf/d total Nov 2023: 1,262 MMcf/d total Dec 2023: 1,249 MMcf/d total Jan 2024: 1,243 MMcf/d total Feb 2024: 1,228 MMcf/d total Mar 2024: 1,223 MMcf/d total Apr 2024: 1,227 MMcf/d total May 2024: 1,165 MMcf/d total Jun 2024: 1,138 MMcf/d total Jul 2024: 1,101 MMcf/d total Aug 2024: 1,105 MMcf/d total Sep 2024: 1,119 MMcf/d total Oct 2024: 1,143 MMcf/d total Nov 2024: 1,227 MMcf/d total Dec 2024: 1,275 MMcf/d total Jan 2025: 1,406 MMcf/d total Feb 2025: 1,381 MMcf/d total Mar 2025: 1,354 MMcf/d total Apr 2025: 1,336 MMcf/d total May 2025: 1,345 MMcf/d total Jun 2025: 1,369 MMcf/d total Jul 2025: 1,341 MMcf/d total Aug 2025: 1,305 MMcf/d total Sep 2025: 1,347 MMcf/d total Oct 2025: 1,356 MMcf/d total Nov 2025: 1,334 MMcf/d total Dec 2025: 1,292 MMcf/d total Jan 2026: 1,259 MMcf/d total Feb 2026: 1,320 MMcf/d total Mar 2026: 1,296 MMcf/d total Apr 2026: 1,367 MMcf/d total May 2026: 1,437 MMcf/d total Jun 2026: 1,331 MMcf/d total Jul 2026: ≈1,292 MMcf/d total (99% arrived, remainder estimated) Aug 2026: ≈1,377 MMcf/d total (99% arrived, remainder estimated) Sep 2026: ≈1,408 MMcf/d total (<1% arrived, remainder estimated) Oct 2026: ≈1,397 MMcf/d total (<1% arrived, remainder estimated)

In this view, hatching marks our estimate, and in the most recent months that is volume still to be filed. Past the divider, the chart continues only the bands it has drawn. Each band continues as our estimate, from any filings already in and then from our forecast, built by summing our per-well forecasts. The method behind each well is recorded with the forecast. The forward months cover existing wells only. How our methods work

All from what the source published. All held at well grain.

How the volume breaks down
  • 82.3% Reported by the official source by well
  • 17.7% Reported by the official source for a longer period, spread across its months. The period total is the reported number.

Every cubic foot through June 2026 starts from what the official source published for those months. Measured over January 2006 to June 2026.

The bands group wells by when they first produced.

About this chart

The stack shows what is holding today's rate up and how much of it is new drilling. In the reported months the bands draw the filings already in. The months still filling in are marked.

Tioga County, Pennsylvania reports no oil production. Its gas is in full below.

Annual table (full history)
YearOil (MMbbl)Gas produced (Bcf)
20250.0492
20240.0433
20230.0424
20220.0346
20210.0290
20200.0339
20190.0349
20180.0302
20170.0221
20160.0195
20150.0199
20140.0208
20130.0220
20120.0203
20110.0127
20100.054
20090.05
20080.01
20070.01
20060.01

Source: CommoVision (commovision.com)

Monthly table (last 24 months)
MonthOil (Mbbl)Gas produced (MMcf)
2026-080.042,237
2026-070.039,608
2026-060.039,809
2026-050.044,543
2026-040.041,007
2026-030.040,178
2026-020.036,957
2026-010.039,035
2025-120.040,062
2025-110.040,029
2025-100.042,047
2025-090.040,424
2025-080.040,447
2025-070.041,556
2025-060.041,070
2025-050.041,685
2025-040.040,084
2025-030.041,981
2025-020.038,658
2025-010.043,595
2024-120.039,531
2024-110.036,820
2024-100.035,425
2024-090.033,576

Source: CommoVision (commovision.com)

Source: CommoVision · Tioga County, Pennsylvania, data through August 2026.

Well map

A map of 1,723 well locations in Tioga County, Pennsylvania for which CommoVision holds a published surface coordinate, each drawn where it is and colored by its primary product (green for oil, red for natural gas, gray where undetermined; a spot shared by more than one product shows the one with the most wells there), on a ground of land and water over faint state and county outlines and place names for orientation, with the drilled wellbore path traced for 834 wells, with a small inset map locating this frame in Pennsylvania.
  • Natural gas 1,408
  • Undetermined 315
1,723 well locations in Tioga County, Pennsylvania, colored by primary product. The drilled path is traced for 834 wells from the directional surveys we hold.
About this map

Undetermined means not enough signal to settle it. Producing wells are the ones that reported oil or gas in the 12 months to Aug 2026.

1,377 MMcf/d (est.) Aug 2026 gas production Aug 2026 is still filling in. The figure is the filings already in plus an estimate of the part not yet filed. The change compares this estimate with the same month last year. +5.5% vs Aug last year
1,347 MMcf/d 2025 gas production
923 wells Producing wells tracked 12 months to Aug 2026
918.6 MMcf/d Existing wells, Oct 2027 forecast Our forecast for existing wells.

Type curves

Tioga County, Pennsylvania natural gas type curves (Mcf/d per well, log scale, against months on production; cohorts 2010–2026)
Tioga County, Pennsylvania natural gas type curves: average thousand cubic feet per day per well on a log scale against months on production 2010-2014: 502 wells in curve; starts at 1,603 Mcf/d per well, 3.2 Bcf cumulative through month 133 (100% of its wells old enough at that month); the dashed curve runs through month 193, on our forecast where a well’s own record ends2015: 35 wells in curve; starts at 3,404 Mcf/d per well, 5.0 Bcf cumulative through month 125 (100% of its wells old enough at that month); the dashed curve runs through month 185, on our forecast where a well’s own record ends2016: 29 wells in curve; starts at 3,160 Mcf/d per well, 4.9 Bcf cumulative through month 110 (100% of its wells old enough at that month); the dashed curve runs through month 170, on our forecast where a well’s own record ends2017: 55 wells in curve; starts at 4,411 Mcf/d per well, 6.4 Bcf cumulative through month 101 (100% of its wells old enough at that month); the dashed curve runs through month 161, on our forecast where a well’s own record ends2018: 33 wells in curve; starts at 5,998 Mcf/d per well, 8.2 Bcf cumulative through month 89 (100% of its wells old enough at that month); the dashed curve runs through month 149, on our forecast where a well’s own record ends2019: 61 wells in curve; starts at 3,916 Mcf/d per well, 7.4 Bcf cumulative through month 82 (100% of its wells old enough at that month); the dashed curve runs through month 142, on our forecast where a well’s own record ends2020: 22 wells in curve; starts at 5,984 Mcf/d per well, 6.4 Bcf cumulative through month 71 (100% of its wells old enough at that month); the dashed curve runs through month 131, on our forecast where a well’s own record ends2021: 14 wells in curve; starts at 3,999 Mcf/d per well, 8.7 Bcf cumulative through month 57 (100% of its wells old enough at that month); the dashed curve runs through month 117, on our forecast where a well’s own record ends2022: 58 wells in curve; starts at 5,173 Mcf/d per well, 7.6 Bcf cumulative through month 45 (100% of its wells old enough at that month); the dashed curve runs through month 105, on our forecast where a well’s own record ends2023: 40 wells in curve; starts at 4,934 Mcf/d per well, 5.8 Bcf cumulative through month 33 (100% of its wells old enough at that month); the dashed curve runs through month 93, on our forecast where a well’s own record ends2024: 45 wells in curve; starts at 4,909 Mcf/d per well, 4.5 Bcf cumulative through month 14 (100% of its wells old enough at that month); the dashed curve runs through month 74, on our forecast where a well’s own record ends2025: 14 wells in curve; starts at 8,126 Mcf/d per well, 4.4 Bcf cumulative through month 12 (100% of its wells old enough at that month); the dashed curve runs through month 72, on our forecast where a well’s own record ends2026: 28 wells in curve; starts at 3,984 Mcf/d per well, 0.1 Bcf cumulative through month 1 (100% of its wells old enough at that month); the dashed curve runs through month 61, on our forecast where a well’s own record ends2005001,0002,0005,00010,00020,000Mcf/d24487296120144168192216Months on production

Horizontal wells only. Average production per well, for wells grouped by when they first produced.

How these curves are built

Horizontal wells only: 936 of the 945 wells in these cohorts. Average daily production per well, for wells grouped by when they first produced. Includes every well of the cohort that is old enough at each month. Wells that are shut in or have stopped producing count as zero, so the average reflects the full cohort, not just survivors. Rates are calendar-day (volume ÷ days in month). The cumulative axis accumulates those same monthly averages at the average month length. Months not yet fully reported are excluded. The 2010-2014 curve draws those years as one group. The chart opens on average daily rate against months on production, the rate on a log scale. The view control switches to rate against cumulative production per well, on the same log rate scale, or to cumulative production per well against months on production, on a linear scale. Every view draws the same cohorts from the same production history. Each cohort is solid through the last month all the wells in its curve sit inside fully reported data. Past it the dashed curve carries the same wells forward, on our forecast where a well’s own record ends, for up to five years. A dashed curve runs as far as at least nine in ten of its wells are accounted for. A well that is old enough but shut in still counts, as zero. The measured months are what these wells reported. In the forward months each well counts its own reported figure for each month it has one, our forecast for each month it has only that, and zero for the rest. The forward average counts every well in the curve. The drawn forecast runs up to five years past the measured months. Line thickness tracks the size of each cohort.

Cohort summary table
First produced Wells in curve Peak gas (Mcf/d per well) Month-12 gas (Mcf/d per well) Cum gas in series (Bcf per well) Months in series Wells old enough at last month in series Forecast months drawn
2026 28 3,984 — 0.1 1 100% 60
2025 14 17,886 8,134 4.4 12 100% 60
2024 45 12,141 9,857 4.5 14 100% 60
2023 40 9,125 6,208 5.8 33 100% 60
2022 58 10,921 8,044 7.6 45 100% 60
2021 14 15,142 7,541 8.7 57 100% 60
2020 22 11,248 4,832 6.4 71 100% 60
2019 61 9,212 5,616 7.4 82 100% 60
2018 33 13,306 5,885 8.2 89 100% 60
2017 55 7,992 3,953 6.4 101 100% 60
2016 29 6,240 2,999 4.9 110 100% 60
2015 35 5,598 2,940 5.0 125 100% 60
2010-2014 502 3,019 1,744 3.2 133 100% 60

Source: CommoVision (commovision.com)

Source: CommoVision · Tioga County, Pennsylvania type curves, per-well production by first-production cohort.

Top operators in Tioga County, Pennsylvania, 2025

  1. Seneca Resources 55.2%
  2. Repsol S.A. 22.0%
  3. Pennsylvania General Energy Company 11.6%
  4. Expand Energy 5.1%
  5. Clean Energy Exploration & Production LLC 2.4%
  6. Diversified Energy Company 1.8%
  7. STL Resources LLC 1.2%
  8. JKLM Energy 0.8%
  9. VEC Energy LLC 0.0%
Top operators in Tioga County, Pennsylvania, 2025: full table
OperatorOil (Mbbl/d, 2025)Gas produced (MMcf/d, 2025)Share of output
Seneca Resources 0.0743.555.2%
Repsol S.A. 0.0296.722.0%
Pennsylvania General Energy Company 0.0155.911.6%
Expand Energy 0.068.05.1%
Clean Energy Exploration & Production LLC 0.031.92.4%
Diversified Energy Company 0.024.31.8%
STL Resources LLC 0.015.91.2%
JKLM Energy 0.010.40.8%
VEC Energy LLC 0.00.30.0%

Mbbl/d = thousand barrels per day · MMcf/d = million cubic feet per day (units).

Source: CommoVision (commovision.com)

Active drilling rigs

2 rigs active in the week to October 16, 2026
±0 rigs vs the same week a year earlier
4 rigs peak week, Dec 2016 (since Oct 2016)
Active drilling rigs by rig type (rigs, weekly count)Source: Baker Hughes
Gas
Active drilling rigs by rig type: rigs, weekly count 1 2 3 4 5 rigs 2017201820192020202120222023202420252026 Week to Oct 21, 2016: 3 rigs total (Gas 3) Week to Oct 28, 2016: 3 rigs total (Gas 3) Week to Nov 4, 2016: 3 rigs total (Gas 3) Week to Nov 11, 2016: 3 rigs total (Gas 3) Week to Nov 18, 2016: 3 rigs total (Gas 3) Week to Nov 23, 2016: 3 rigs total (Gas 3) Week to Dec 2, 2016: 3 rigs total (Gas 3) Week to Dec 9, 2016: 4 rigs total (Gas 4) Week to Dec 16, 2016: 4 rigs total (Gas 4) Week to Dec 23, 2016: 3 rigs total (Gas 3) Week to Dec 30, 2016: 3 rigs total (Gas 3) Week to Jan 6, 2017: 4 rigs total (Gas 4) Week to Jan 13, 2017: 3 rigs total (Gas 3) Week to Jan 20, 2017: 3 rigs total (Gas 3) Week to Jan 27, 2017: 3 rigs total (Gas 3) Week to Feb 3, 2017: 3 rigs total (Gas 3) Week to Feb 10, 2017: 4 rigs total (Gas 4) Week to Feb 17, 2017: 4 rigs total (Gas 4) Week to Feb 24, 2017: 4 rigs total (Gas 4) Week to Mar 3, 2017: 4 rigs total (Gas 4) Week to Mar 10, 2017: 4 rigs total (Gas 4) Week to Mar 17, 2017: 4 rigs total (Gas 4) Week to Mar 24, 2017: 4 rigs total (Gas 4) Week to Mar 31, 2017: 4 rigs total (Gas 4) Week to Apr 7, 2017: 4 rigs total (Gas 4) Week to Apr 13, 2017: 4 rigs total (Gas 4) Week to Apr 21, 2017: 4 rigs total (Gas 4) Week to Apr 28, 2017: 4 rigs total (Gas 4) Week to May 5, 2017: 4 rigs total (Gas 4) Week to May 12, 2017: 4 rigs total (Gas 4) Week to May 19, 2017: 4 rigs total (Gas 4) Week to May 26, 2017: 4 rigs total (Gas 4) Week to Jun 2, 2017: 4 rigs total (Gas 4) Week to Jun 9, 2017: 4 rigs total (Gas 4) Week to Jun 16, 2017: 4 rigs total (Gas 4) Week to Jun 23, 2017: 4 rigs total (Gas 4) Week to Jun 30, 2017: 4 rigs total (Gas 4) Week to Jul 7, 2017: 4 rigs total (Gas 4) Week to Jul 14, 2017: 4 rigs total (Gas 4) Week to Jul 21, 2017: 4 rigs total (Gas 4) Week to Jul 28, 2017: 4 rigs total (Gas 4) Week to Aug 4, 2017: 4 rigs total (Gas 4) Week to Aug 11, 2017: 4 rigs total (Gas 4) Week to Aug 18, 2017: 4 rigs total (Gas 4) Week to Aug 25, 2017: 3 rigs total (Gas 3) Week to Sep 1, 2017: 3 rigs total (Gas 3) Week to Sep 8, 2017: 3 rigs total (Gas 3) Week to Sep 15, 2017: 3 rigs total (Gas 3) Week to Sep 22, 2017: 3 rigs total (Gas 3) Week to Sep 29, 2017: 3 rigs total (Gas 3) Week to Oct 6, 2017: 3 rigs total (Gas 3) Week to Oct 13, 2017: 3 rigs total (Gas 3) Week to Oct 20, 2017: 3 rigs total (Gas 3) Week to Oct 27, 2017: 3 rigs total (Gas 3) Week to Nov 3, 2017: 3 rigs total (Gas 3) Week to Nov 10, 2017: 3 rigs total (Gas 3) Week to Nov 17, 2017: 3 rigs total (Gas 3) Week to Nov 22, 2017: 3 rigs total (Gas 3) Week to Dec 1, 2017: 3 rigs total (Gas 3) Week to Dec 8, 2017: 2 rigs total (Gas 2) Week to Dec 15, 2017: 2 rigs total (Gas 2) Week to Dec 22, 2017: 2 rigs total (Gas 2) Week to Dec 29, 2017: 2 rigs total (Gas 2) Week to Jan 5, 2018: 2 rigs total (Gas 2) Week to Jan 12, 2018: 2 rigs total (Gas 2) Week to Jan 19, 2018: 1 rig total (Gas 1) Week to Jan 26, 2018: 1 rig total (Gas 1) Week to Feb 2, 2018: 1 rig total (Gas 1) Week to Feb 9, 2018: 1 rig total (Gas 1) Week to Feb 16, 2018: 2 rigs total (Gas 2) Week to Feb 23, 2018: 2 rigs total (Gas 2) Week to Mar 2, 2018: 2 rigs total (Gas 2) Week to Mar 9, 2018: 3 rigs total (Gas 3) Week to Mar 16, 2018: 3 rigs total (Gas 3) Week to Mar 23, 2018: 3 rigs total (Gas 3) Week to Mar 29, 2018: 4 rigs total (Gas 4) Week to Apr 6, 2018: 4 rigs total (Gas 4) Week to Apr 13, 2018: 4 rigs total (Gas 4) Week to Apr 20, 2018: 3 rigs total (Gas 3) Week to Apr 27, 2018: 3 rigs total (Gas 3) Week to May 4, 2018: 4 rigs total (Gas 4) Week to May 11, 2018: 3 rigs total (Gas 3) Week to May 18, 2018: 2 rigs total (Gas 2) Week to May 25, 2018: 2 rigs total (Gas 2) Week to Jun 1, 2018: 2 rigs total (Gas 2) Week to Jun 8, 2018: 2 rigs total (Gas 2) Week to Jun 15, 2018: 1 rig total (Gas 1) Week to Jun 22, 2018: 1 rig total (Gas 1) Week to Jun 29, 2018: 1 rig total (Gas 1) Week to Jul 6, 2018: 2 rigs total (Gas 2) Week to Jul 13, 2018: 2 rigs total (Gas 2) Week to Jul 20, 2018: 3 rigs total (Gas 3) Week to Jul 27, 2018: 3 rigs total (Gas 3) Week to Aug 3, 2018: 2 rigs total (Gas 2) Week to Aug 10, 2018: 2 rigs total (Gas 2) Week to Aug 17, 2018: 2 rigs total (Gas 2) Week to Aug 24, 2018: 2 rigs total (Gas 2) Week to Aug 31, 2018: 2 rigs total (Gas 2) Week to Sep 7, 2018: 2 rigs total (Gas 2) Week to Sep 14, 2018: 2 rigs total (Gas 2) Week to Sep 21, 2018: 2 rigs total (Gas 2) Week to Sep 28, 2018: 2 rigs total (Gas 2) Week to Oct 5, 2018: 2 rigs total (Gas 2) Week to Oct 12, 2018: 3 rigs total (Gas 3) Week to Oct 19, 2018: 3 rigs total (Gas 3) Week to Oct 26, 2018: 2 rigs total (Gas 2) Week to Nov 2, 2018: 3 rigs total (Gas 3) Week to Nov 9, 2018: 3 rigs total (Gas 3) Week to Nov 16, 2018: 3 rigs total (Gas 3) Week to Nov 21, 2018: 3 rigs total (Gas 3) Week to Nov 30, 2018: 3 rigs total (Gas 3) Week to Dec 7, 2018: 3 rigs total (Gas 3) Week to Dec 14, 2018: 2 rigs total (Gas 2) Week to Dec 21, 2018: 3 rigs total (Gas 3) Week to Dec 28, 2018: 3 rigs total (Gas 3) Week to Jan 4, 2019: 3 rigs total (Gas 3) Week to Jan 11, 2019: 2 rigs total (Gas 2) Week to Jan 18, 2019: 2 rigs total (Gas 2) Week to Jan 25, 2019: 2 rigs total (Gas 2) Week to Feb 1, 2019: 2 rigs total (Gas 2) Week to Feb 8, 2019: 2 rigs total (Gas 2) Week to Feb 15, 2019: 1 rig total (Gas 1) Week to Feb 22, 2019: 1 rig total (Gas 1) Week to Mar 1, 2019: 1 rig total (Gas 1) Week to Mar 8, 2019: 2 rigs total (Gas 2) Week to Mar 15, 2019: 2 rigs total (Gas 2) Week to Mar 22, 2019: 2 rigs total (Gas 2) Week to Mar 29, 2019: 2 rigs total (Gas 2) Week to Apr 5, 2019: 3 rigs total (Gas 3) Week to Apr 12, 2019: 2 rigs total (Gas 2) Week to Apr 18, 2019: 3 rigs total (Gas 3) Week to Apr 26, 2019: 3 rigs total (Gas 3) Week to May 3, 2019: 3 rigs total (Gas 3) Week to May 10, 2019: 3 rigs total (Gas 3) Week to May 17, 2019: 3 rigs total (Gas 3) Week to May 24, 2019: 3 rigs total (Gas 3) Week to May 31, 2019: 2 rigs total (Gas 2) Week to Jun 7, 2019: 2 rigs total (Gas 2) Week to Jun 14, 2019: 2 rigs total (Gas 2) Week to Jun 21, 2019: 2 rigs total (Gas 2) Week to Jun 28, 2019: 2 rigs total (Gas 2) Week to Jul 3, 2019: 2 rigs total (Gas 2) Week to Jul 12, 2019: 2 rigs total (Gas 2) Week to Jul 19, 2019: 2 rigs total (Gas 2) Week to Jul 26, 2019: 2 rigs total (Gas 2) Week to Aug 2, 2019: 2 rigs total (Gas 2) Week to Aug 9, 2019: 2 rigs total (Gas 2) Week to Aug 16, 2019: 3 rigs total (Gas 3) Week to Aug 23, 2019: 2 rigs total (Gas 2) Week to Aug 30, 2019: 2 rigs total (Gas 2) Week to Sep 6, 2019: 2 rigs total (Gas 2) Week to Sep 13, 2019: 2 rigs total (Gas 2) Week to Sep 20, 2019: 2 rigs total (Gas 2) Week to Sep 27, 2019: 2 rigs total (Gas 2) Week to Oct 4, 2019: 2 rigs total (Gas 2) Week to Oct 11, 2019: 3 rigs total (Gas 3) Week to Oct 18, 2019: 3 rigs total (Gas 3) Week to Oct 25, 2019: 3 rigs total (Gas 3) Week to Nov 1, 2019: 2 rigs total (Gas 2) Week to Nov 8, 2019: 2 rigs total (Gas 2) Week to Nov 15, 2019: 2 rigs total (Gas 2) Week to Nov 22, 2019: 1 rig total (Gas 1) Week to Nov 27, 2019: 1 rig total (Gas 1) Week to Dec 6, 2019: 1 rig total (Gas 1) Week to Dec 13, 2019: 1 rig total (Gas 1) Week to Dec 20, 2019: 1 rig total (Gas 1) Week to Dec 27, 2019: 1 rig total (Gas 1) Week to Jan 3, 2020: 1 rig total (Gas 1) Week to Jan 10, 2020: 1 rig total (Gas 1) Week to Jan 17, 2020: 1 rig total (Gas 1) Week to Jan 24, 2020: 1 rig total (Gas 1) Week to Jan 31, 2020: 1 rig total (Gas 1) Week to Feb 7, 2020: 1 rig total (Gas 1) Week to Feb 14, 2020: 1 rig total (Gas 1) Week to Feb 21, 2020: 1 rig total (Gas 1) Week to Feb 28, 2020: 1 rig total (Gas 1) Week to Mar 6, 2020: 1 rig total (Gas 1) Week to Mar 13, 2020: 1 rig total (Gas 1) Week to Mar 20, 2020: 1 rig total (Gas 1) Week to Mar 27, 2020: 1 rig total (Gas 1) Week to Apr 3, 2020: 1 rig total (Gas 1) Week to Apr 9, 2020: 1 rig total (Gas 1) Week to Apr 17, 2020: 1 rig total (Gas 1) Week to Apr 24, 2020: 1 rig total (Gas 1) Week to May 1, 2020: 1 rig total (Gas 1) Week to May 8, 2020: 1 rig total (Gas 1) Week to May 15, 2020: 1 rig total (Gas 1) Week to May 22, 2020: 1 rig total (Gas 1) Week to May 29, 2020: 1 rig total (Gas 1) Week to Jun 5, 2020: 1 rig total (Gas 1) Week to Jun 12, 2020: 1 rig total (Gas 1) Week to Jun 19, 2020: 0 rigs total (Gas 0) Week to Jun 26, 2020: 0 rigs total (Gas 0) Week to Jul 2, 2020: 0 rigs total (Gas 0) Week to Jul 10, 2020: 0 rigs total (Gas 0) Week to Jul 17, 2020: 0 rigs total (Gas 0) Week to Jul 24, 2020: 0 rigs total (Gas 0) Week to Jul 31, 2020: 0 rigs total (Gas 0) Week to Aug 7, 2020: 0 rigs total (Gas 0) Week to Aug 14, 2020: 0 rigs total (Gas 0) Week to Aug 21, 2020: 0 rigs total (Gas 0) Week to Aug 28, 2020: 0 rigs total (Gas 0) Week to Sep 4, 2020: 0 rigs total (Gas 0) Week to Sep 11, 2020: 0 rigs total (Gas 0) Week to Sep 18, 2020: 0 rigs total (Gas 0) Week to Sep 25, 2020: 1 rig total (Gas 1) Week to Oct 2, 2020: 1 rig total (Gas 1) Week to Oct 9, 2020: 1 rig total (Gas 1) Week to Oct 16, 2020: 1 rig total (Gas 1) Week to Oct 23, 2020: 1 rig total (Gas 1) Week to Oct 30, 2020: 1 rig total (Gas 1) Week to Nov 6, 2020: 1 rig total (Gas 1) Week to Nov 13, 2020: 1 rig total (Gas 1) Week to Nov 20, 2020: 1 rig total (Gas 1) Week to Nov 25, 2020: 1 rig total (Gas 1) Week to Dec 4, 2020: 0 rigs total (Gas 0) Week to Dec 11, 2020: 0 rigs total (Gas 0) Week to Dec 18, 2020: 0 rigs total (Gas 0) Week to Dec 23, 2020: 0 rigs total (Gas 0) Week to Dec 31, 2020: 0 rigs total (Gas 0) Week to Jan 8, 2021: 0 rigs total (Gas 0) Week to Jan 15, 2021: 0 rigs total (Gas 0) Week to Jan 22, 2021: 0 rigs total (Gas 0) Week to Jan 29, 2021: 0 rigs total (Gas 0) Week to Feb 5, 2021: 0 rigs total (Gas 0) Week to Feb 12, 2021: 0 rigs total (Gas 0) Week to Feb 19, 2021: 0 rigs total (Gas 0) Week to Feb 26, 2021: 0 rigs total (Gas 0) Week to Mar 5, 2021: 0 rigs total (Gas 0) Week to Mar 12, 2021: 0 rigs total (Gas 0) Week to Mar 19, 2021: 0 rigs total (Gas 0) Week to Mar 26, 2021: 0 rigs total (Gas 0) Week to Apr 1, 2021: 0 rigs total (Gas 0) Week to Apr 9, 2021: 2 rigs total (Gas 2) Week to Apr 16, 2021: 2 rigs total (Gas 2) Week to Apr 23, 2021: 2 rigs total (Gas 2) Week to Apr 30, 2021: 2 rigs total (Gas 2) Week to May 7, 2021: 2 rigs total (Gas 2) Week to May 14, 2021: 2 rigs total (Gas 2) Week to May 21, 2021: 2 rigs total (Gas 2) Week to May 28, 2021: 2 rigs total (Gas 2) Week to Jun 4, 2021: 2 rigs total (Gas 2) Week to Jun 11, 2021: 2 rigs total (Gas 2) Week to Jun 18, 2021: 1 rig total (Gas 1) Week to Jun 25, 2021: 1 rig total (Gas 1) Week to Jul 2, 2021: 1 rig total (Gas 1) Week to Jul 9, 2021: 1 rig total (Gas 1) Week to Jul 16, 2021: 1 rig total (Gas 1) Week to Jul 23, 2021: 1 rig total (Gas 1) Week to Jul 30, 2021: 1 rig total (Gas 1) Week to Aug 6, 2021: 1 rig total (Gas 1) Week to Aug 13, 2021: 1 rig total (Gas 1) Week to Aug 20, 2021: 2 rigs total (Gas 2) Week to Aug 27, 2021: 2 rigs total (Gas 2) Week to Sep 3, 2021: 2 rigs total (Gas 2) Week to Sep 10, 2021: 1 rig total (Gas 1) Week to Sep 17, 2021: 1 rig total (Gas 1) Week to Sep 24, 2021: 1 rig total (Gas 1) Week to Oct 1, 2021: 1 rig total (Gas 1) Week to Oct 8, 2021: 1 rig total (Gas 1) Week to Oct 15, 2021: 1 rig total (Gas 1) Week to Oct 22, 2021: 1 rig total (Gas 1) Week to Oct 29, 2021: 1 rig total (Gas 1) Week to Nov 5, 2021: 2 rigs total (Gas 2) Week to Nov 12, 2021: 2 rigs total (Gas 2) Week to Nov 19, 2021: 2 rigs total (Gas 2) Week to Nov 24, 2021: 2 rigs total (Gas 2) Week to Dec 3, 2021: 2 rigs total (Gas 2) Week to Dec 10, 2021: 2 rigs total (Gas 2) Week to Dec 17, 2021: 3 rigs total (Gas 3) Week to Dec 23, 2021: 3 rigs total (Gas 3) Week to Dec 31, 2021: 3 rigs total (Gas 3) Week to Jan 7, 2022: 3 rigs total (Gas 3) Week to Jan 14, 2022: 3 rigs total (Gas 3) Week to Jan 21, 2022: 3 rigs total (Gas 3) Week to Jan 28, 2022: 3 rigs total (Gas 3) Week to Feb 4, 2022: 2 rigs total (Gas 2) Week to Feb 11, 2022: 4 rigs total (Gas 4) Week to Feb 18, 2022: 4 rigs total (Gas 4) Week to Feb 25, 2022: 4 rigs total (Gas 4) Week to Mar 4, 2022: 4 rigs total (Gas 4) Week to Mar 11, 2022: 4 rigs total (Gas 4) Week to Mar 18, 2022: 3 rigs total (Gas 3) Week to Mar 25, 2022: 2 rigs total (Gas 2) Week to Apr 1, 2022: 3 rigs total (Gas 3) Week to Apr 8, 2022: 4 rigs total (Gas 4) Week to Apr 14, 2022: 4 rigs total (Gas 4) Week to Apr 22, 2022: 4 rigs total (Gas 4) Week to Apr 29, 2022: 4 rigs total (Gas 4) Week to May 6, 2022: 4 rigs total (Gas 4) Week to May 13, 2022: 4 rigs total (Gas 4) Week to May 20, 2022: 4 rigs total (Gas 4) Week to May 27, 2022: 3 rigs total (Gas 3) Week to Jun 3, 2022: 3 rigs total (Gas 3) Week to Jun 10, 2022: 3 rigs total (Gas 3) Week to Jun 17, 2022: 3 rigs total (Gas 3) Week to Jun 24, 2022: 3 rigs total (Gas 3) Week to Jul 1, 2022: 3 rigs total (Gas 3) Week to Jul 8, 2022: 3 rigs total (Gas 3) Week to Jul 15, 2022: 3 rigs total (Gas 3) Week to Jul 22, 2022: 3 rigs total (Gas 3) Week to Jul 29, 2022: 4 rigs total (Gas 4) Week to Aug 5, 2022: 4 rigs total (Gas 4) Week to Aug 12, 2022: 4 rigs total (Gas 4) Week to Aug 19, 2022: 4 rigs total (Gas 4) Week to Aug 26, 2022: 3 rigs total (Gas 3) Week to Sep 2, 2022: 3 rigs total (Gas 3) Week to Sep 9, 2022: 3 rigs total (Gas 3) Week to Sep 16, 2022: 3 rigs total (Gas 3) Week to Sep 23, 2022: 3 rigs total (Gas 3) Week to Sep 30, 2022: 2 rigs total (Gas 2) Week to Oct 7, 2022: 2 rigs total (Gas 2) Week to Oct 14, 2022: 3 rigs total (Gas 3) Week to Oct 21, 2022: 3 rigs total (Gas 3) Week to Oct 28, 2022: 3 rigs total (Gas 3) Week to Nov 4, 2022: 3 rigs total (Gas 3) Week to Nov 10, 2022: 3 rigs total (Gas 3) Week to Nov 18, 2022: 3 rigs total (Gas 3) Week to Nov 23, 2022: 3 rigs total (Gas 3) Week to Dec 2, 2022: 3 rigs total (Gas 3) Week to Dec 9, 2022: 3 rigs total (Gas 3) Week to Dec 16, 2022: 3 rigs total (Gas 3) Week to Dec 22, 2022: 3 rigs total (Gas 3) Week to Dec 30, 2022: 3 rigs total (Gas 3) Week to Jan 6, 2023: 3 rigs total (Gas 3) Week to Jan 13, 2023: 3 rigs total (Gas 3) Week to Jan 20, 2023: 2 rigs total (Gas 2) Week to Jan 27, 2023: 2 rigs total (Gas 2) Week to Feb 3, 2023: 2 rigs total (Gas 2) Week to Feb 10, 2023: 2 rigs total (Gas 2) Week to Feb 17, 2023: 2 rigs total (Gas 2) Week to Feb 24, 2023: 2 rigs total (Gas 2) Week to Mar 3, 2023: 2 rigs total (Gas 2) Week to Mar 10, 2023: 1 rig total (Gas 1) Week to Mar 17, 2023: 1 rig total (Gas 1) Week to Mar 24, 2023: 2 rigs total (Gas 2) Week to Mar 31, 2023: 2 rigs total (Gas 2) Week to Apr 6, 2023: 2 rigs total (Gas 2) Week to Apr 14, 2023: 1 rig total (Gas 1) Week to Apr 21, 2023: 1 rig total (Gas 1) Week to Apr 28, 2023: 2 rigs total (Gas 2) Week to May 5, 2023: 2 rigs total (Gas 2) Week to May 12, 2023: 2 rigs total (Gas 2) Week to May 19, 2023: 2 rigs total (Gas 2) Week to May 26, 2023: 2 rigs total (Gas 2) Week to Jun 2, 2023: 2 rigs total (Gas 2) Week to Jun 9, 2023: 2 rigs total (Gas 2) Week to Jun 16, 2023: 1 rig total (Gas 1) Week to Jun 23, 2023: 1 rig total (Gas 1) Week to Jun 30, 2023: 1 rig total (Gas 1) Week to Jul 7, 2023: 1 rig total (Gas 1) Week to Jul 14, 2023: 1 rig total (Gas 1) Week to Jul 21, 2023: 1 rig total (Gas 1) Week to Jul 28, 2023: 1 rig total (Gas 1) Week to Aug 4, 2023: 1 rig total (Gas 1) Week to Aug 11, 2023: 1 rig total (Gas 1) Week to Aug 18, 2023: 1 rig total (Gas 1) Week to Aug 25, 2023: 1 rig total (Gas 1) Week to Sep 1, 2023: 1 rig total (Gas 1) Week to Sep 8, 2023: 1 rig total (Gas 1) Week to Sep 15, 2023: 1 rig total (Gas 1) Week to Sep 22, 2023: 1 rig total (Gas 1) Week to Sep 29, 2023: 1 rig total (Gas 1) Week to Oct 6, 2023: 1 rig total (Gas 1) Week to Oct 13, 2023: 2 rigs total (Gas 2) Week to Oct 20, 2023: 2 rigs total (Gas 2) Week to Oct 27, 2023: 2 rigs total (Gas 2) Week to Nov 3, 2023: 2 rigs total (Gas 2) Week to Nov 10, 2023: 2 rigs total (Gas 2) Week to Nov 17, 2023: 2 rigs total (Gas 2) Week to Nov 22, 2023: 2 rigs total (Gas 2) Week to Dec 1, 2023: 2 rigs total (Gas 2) Week to Dec 8, 2023: 2 rigs total (Gas 2) Week to Dec 15, 2023: 2 rigs total (Gas 2) Week to Dec 21, 2023: 2 rigs total (Gas 2) Week to Dec 29, 2023: 2 rigs total (Gas 2) Week to Jan 5, 2024: 2 rigs total (Gas 2) Week to Jan 12, 2024: 2 rigs total (Gas 2) Week to Jan 19, 2024: 2 rigs total (Gas 2) Week to Jan 26, 2024: 2 rigs total (Gas 2) Week to Feb 2, 2024: 2 rigs total (Gas 2) Week to Feb 9, 2024: 3 rigs total (Gas 3) Week to Feb 16, 2024: 3 rigs total (Gas 3) Week to Feb 23, 2024: 3 rigs total (Gas 3) Week to Mar 1, 2024: 3 rigs total (Gas 3) Week to Mar 8, 2024: 3 rigs total (Gas 3) Week to Mar 15, 2024: 3 rigs total (Gas 3) Week to Mar 22, 2024: 3 rigs total (Gas 3) Week to Mar 28, 2024: 3 rigs total (Gas 3) Week to Apr 5, 2024: 3 rigs total (Gas 3) Week to Apr 12, 2024: 3 rigs total (Gas 3) Week to Apr 19, 2024: 3 rigs total (Gas 3) Week to Apr 26, 2024: 3 rigs total (Gas 3) Week to May 3, 2024: 3 rigs total (Gas 3) Week to May 10, 2024: 3 rigs total (Gas 3) Week to May 17, 2024: 3 rigs total (Gas 3) Week to May 24, 2024: 1 rig total (Gas 1) Week to May 31, 2024: 1 rig total (Gas 1) Week to Jun 7, 2024: 1 rig total (Gas 1) Week to Jun 14, 2024: 1 rig total (Gas 1) Week to Jun 21, 2024: 1 rig total (Gas 1) Week to Jun 28, 2024: 1 rig total (Gas 1) Week to Jul 5, 2024: 1 rig total (Gas 1) Week to Jul 12, 2024: 1 rig total (Gas 1) Week to Jul 19, 2024: 1 rig total (Gas 1) Week to Jul 26, 2024: 1 rig total (Gas 1) Week to Aug 2, 2024: 1 rig total (Gas 1) Week to Aug 9, 2024: 1 rig total (Gas 1) Week to Aug 16, 2024: 1 rig total (Gas 1) Week to Aug 23, 2024: 1 rig total (Gas 1) Week to Aug 30, 2024: 1 rig total (Gas 1) Week to Sep 6, 2024: 1 rig total (Gas 1) Week to Sep 13, 2024: 1 rig total (Gas 1) Week to Sep 20, 2024: 1 rig total (Gas 1) Week to Sep 27, 2024: 1 rig total (Gas 1) Week to Oct 4, 2024: 2 rigs total (Gas 2) Week to Oct 11, 2024: 2 rigs total (Gas 2) Week to Oct 18, 2024: 2 rigs total (Gas 2) Week to Oct 25, 2024: 2 rigs total (Gas 2) Week to Nov 1, 2024: 1 rig total (Gas 1) Week to Nov 8, 2024: 2 rigs total (Gas 2) Week to Nov 15, 2024: 2 rigs total (Gas 2) Week to Nov 22, 2024: 2 rigs total (Gas 2) Week to Nov 27, 2024: 2 rigs total (Gas 2) Week to Dec 6, 2024: 2 rigs total (Gas 2) Week to Dec 13, 2024: 1 rig total (Gas 1) Week to Dec 20, 2024: 1 rig total (Gas 1) Week to Dec 27, 2024: 1 rig total (Gas 1) Week to Jan 3, 2025: 1 rig total (Gas 1) Week to Jan 10, 2025: 1 rig total (Gas 1) Week to Jan 17, 2025: 1 rig total (Gas 1) Week to Jan 24, 2025: 1 rig total (Gas 1) Week to Jan 31, 2025: 1 rig total (Gas 1) Week to Feb 7, 2025: 1 rig total (Gas 1) Week to Feb 14, 2025: 1 rig total (Gas 1) Week to Feb 21, 2025: 1 rig total (Gas 1) Week to Feb 28, 2025: 1 rig total (Gas 1) Week to Mar 7, 2025: 0 rigs total (Gas 0) Week to Mar 14, 2025: 0 rigs total (Gas 0) Week to Mar 21, 2025: 0 rigs total (Gas 0) Week to Mar 28, 2025: 0 rigs total (Gas 0) Week to Apr 4, 2025: 0 rigs total (Gas 0) Week to Apr 11, 2025: 0 rigs total (Gas 0) Week to Apr 17, 2025: 0 rigs total (Gas 0) Week to Apr 25, 2025: 0 rigs total (Gas 0) Week to May 2, 2025: 0 rigs total (Gas 0) Week to May 9, 2025: 0 rigs total (Gas 0) Week to May 16, 2025: 0 rigs total (Gas 0) Week to May 23, 2025: 0 rigs total (Gas 0) Week to May 30, 2025: 0 rigs total (Gas 0) Week to Jun 6, 2025: 1 rig total (Gas 1) Week to Jun 13, 2025: 1 rig total (Gas 1) Week to Jun 20, 2025: 1 rig total (Gas 1) Week to Jun 27, 2025: 1 rig total (Gas 1) Week to Jul 3, 2025: 1 rig total (Gas 1) Week to Jul 11, 2025: 1 rig total (Gas 1) Week to Jul 18, 2025: 1 rig total (Gas 1) Week to Jul 25, 2025: 2 rigs total (Gas 2) Week to Aug 1, 2025: 2 rigs total (Gas 2) Week to Aug 8, 2025: 2 rigs total (Gas 2) Week to Aug 15, 2025: 2 rigs total (Gas 2) Week to Aug 22, 2025: 2 rigs total (Gas 2) Week to Aug 29, 2025: 2 rigs total (Gas 2) Week to Sep 5, 2025: 2 rigs total (Gas 2) Week to Sep 12, 2025: 2 rigs total (Gas 2) Week to Sep 19, 2025: 2 rigs total (Gas 2) Week to Sep 26, 2025: 2 rigs total (Gas 2) Week to Oct 3, 2025: 2 rigs total (Gas 2) Week to Oct 10, 2025: 2 rigs total (Gas 2) Week to Oct 17, 2025: 2 rigs total (Gas 2) Week to Oct 24, 2025: 2 rigs total (Gas 2) Week to Oct 31, 2025: 2 rigs total (Gas 2) Week to Nov 6, 2025: 2 rigs total (Gas 2) Week to Nov 14, 2025: 2 rigs total (Gas 2) Week to Nov 21, 2025: 2 rigs total (Gas 2) Week to Nov 26, 2025: 2 rigs total (Gas 2) Week to Dec 4, 2025: 2 rigs total (Gas 2) Week to Dec 12, 2025: 2 rigs total (Gas 2) Week to Dec 19, 2025: 2 rigs total (Gas 2) Week to Dec 24, 2025: 2 rigs total (Gas 2) Week to Dec 30, 2025: 2 rigs total (Gas 2) Week to Jan 9, 2026: 2 rigs total (Gas 2) Week to Jan 16, 2026: 2 rigs total (Gas 2) Week to Jan 23, 2026: 2 rigs total (Gas 2) Week to Jan 30, 2026: 2 rigs total (Gas 2) Week to Feb 6, 2026: 2 rigs total (Gas 2) Week to Feb 13, 2026: 2 rigs total (Gas 2) Week to Feb 20, 2026: 2 rigs total (Gas 2) Week to Feb 27, 2026: 2 rigs total (Gas 2) Week to Mar 6, 2026: 2 rigs total (Gas 2) Week to Mar 13, 2026: 2 rigs total (Gas 2) Week to Mar 20, 2026: 2 rigs total (Gas 2) Week to Mar 27, 2026: 2 rigs total (Gas 2) Week to Apr 2, 2026: 2 rigs total (Gas 2) Week to Apr 10, 2026: 2 rigs total (Gas 2) Week to Apr 17, 2026: 2 rigs total (Gas 2) Week to Apr 24, 2026: 2 rigs total (Gas 2) Week to May 1, 2026: 2 rigs total (Gas 2) Week to May 8, 2026: 2 rigs total (Gas 2) Week to May 15, 2026: 2 rigs total (Gas 2) Week to May 22, 2026: 2 rigs total (Gas 2) Week to May 29, 2026: 2 rigs total (Gas 2) Week to Jun 5, 2026: 2 rigs total (Gas 2) Week to Jun 12, 2026: 2 rigs total (Gas 2) Week to Jun 18, 2026: 2 rigs total (Gas 2) Week to Jun 26, 2026: 2 rigs total (Gas 2) Week to Jul 2, 2026: 2 rigs total (Gas 2) Week to Jul 10, 2026: 2 rigs total (Gas 2) Week to Jul 17, 2026: 2 rigs total (Gas 2) Week to Jul 24, 2026: 2 rigs total (Gas 2) Week to Jul 31, 2026: 2 rigs total (Gas 2) Week to Aug 7, 2026: 2 rigs total (Gas 2) Week to Aug 14, 2026: 2 rigs total (Gas 2) Week to Aug 21, 2026: 2 rigs total (Gas 2) Week to Aug 28, 2026: 2 rigs total (Gas 2) Week to Sep 4, 2026: 2 rigs total (Gas 2) Week to Sep 11, 2026: 2 rigs total (Gas 2) Week to Sep 18, 2026: 2 rigs total (Gas 2) Week to Sep 25, 2026: 2 rigs total (Gas 2) Week to Oct 2, 2026: 2 rigs total (Gas 2) Week to Oct 9, 2026: 2 rigs total (Gas 2) Week to Oct 16, 2026: 2 rigs total (Gas 2)

Interactive chart. Focus it and use the left and right arrow keys to read each week, Page Up and Page Down to move a year, Home and End for the ends of the series. The full figures are also in the table below.

  • In Tioga County, Pennsylvania, 2 drilling rigs were active in the week to October 16, 2026 (unchanged from a year earlier).
  • Since Oct 2016, the weekly count peaked at 4 in Dec 2016.
  • The count covers land and inland-water rigs; rigs in US federal offshore waters are counted on the Gulf of Mexico page.
Average active rigs per month: full table
Month Gas-directedAll rigs
Oct 2026 (through October 16, 2026)22
Sep 202622
Aug 202622
Jul 202622
Jun 202622
May 202622
Apr 202622
Mar 202622
Feb 202622
Jan 202622
Dec 202522
Nov 202522
Oct 202522
Sep 202522
Aug 202522
Jul 20251.51.5
Jun 202511
May 202500
Apr 202500
Mar 202500
Feb 202511
Jan 202511
Dec 20241.21.2
Nov 202422

Source: CommoVision (commovision.com)

What we cover here

Each row names the grain a region’s production is held at. Where a source publishes at a coarser grain, the page says so.

DataGrainSinceBenchmark
Pennsylvania production well 1980-01 ~100% of EIA

Benchmark cells compare our series with the EIA’s published estimates.

About the EIA comparison

The two are produced differently: the EIA estimates from a survey of the largest operators and a model built to anticipate late filings, while the series compared here are rebuilt from the source’s own records as they arrive. Recent months can differ without either being wrong; the methodology page explains both methods.

Coverage rows for Tioga County, Pennsylvania are regenerated at every build from the same catalog of sources the data is built from.

What the data shows

  • Tioga County, Pennsylvania produced 491.6 Bcf of natural gas in 2025.
  • Tioga County, Pennsylvania gas production reached its highest level on record in 2025 at 491.6 Bcf.
  • 923 producing wells tracked, 12 months to Aug 2026.

Start a free trial

Watch supply move as soon as its sources publish, with forecasts on 1.1+ million producing wells. The portal is open, with a real API and MCP access for AI tools.

What the trial includes

Data use is subject to our Terms of Service.