CommoVision

See the future in real time

Operator

Suncor Energy

Suncor Energy produced 205.2 MMbbl of oil and 62.1 Bcf of natural gas in 2025. 507 operated producing wells tracked, trailing 12 months per region.

  • Second-largest operator by operated oil in Alberta, 2025.
  • Operated 12.4% of the oil produced in Alberta, 2025.
  • Oil production rose 2% in 2025 from 2024.
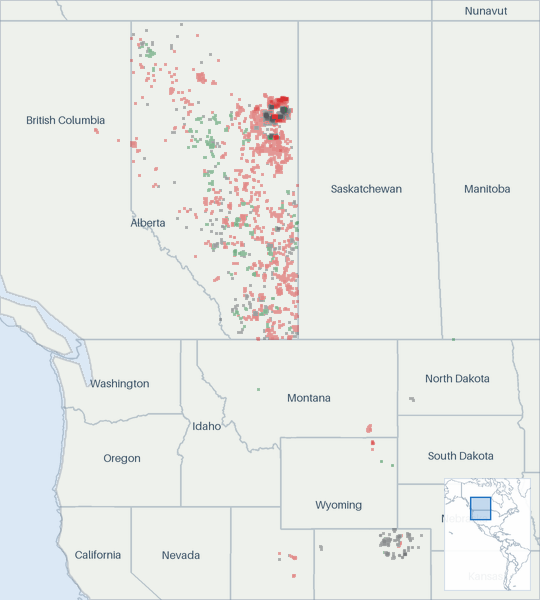
Well map of Suncor Energy. The full map is further down this page.

Production

Suncor Energy oil production (Mbbl/d, monthly average, grouped by when each well first produced)
Suncor Energy oil production: thousand barrels per day, by first-production vintage as filed so far today 200400600800 Mbbl/d 2017201820192020202120222023202420252026 Aug 2016: 596 Mbbl/d total Sep 2016: 521 Mbbl/d total Oct 2016: 560 Mbbl/d total Nov 2016: 614 Mbbl/d total Dec 2016: 537 Mbbl/d total Jan 2017: 578 Mbbl/d total Feb 2017: 607 Mbbl/d total Mar 2017: 559 Mbbl/d total Apr 2017: 471 Mbbl/d total May 2017: 428 Mbbl/d total Jun 2017: 497 Mbbl/d total Jul 2017: 601 Mbbl/d total Aug 2017: 579 Mbbl/d total Sep 2017: 549 Mbbl/d total Oct 2017: 572 Mbbl/d total Nov 2017: 579 Mbbl/d total Dec 2017: 565 Mbbl/d total Jan 2018: 404 Mbbl/d total Feb 2018: 558 Mbbl/d total Mar 2018: 597 Mbbl/d total Apr 2018: 396 Mbbl/d total May 2018: 467 Mbbl/d total Jun 2018: 541 Mbbl/d total Jul 2018: 604 Mbbl/d total Aug 2018: 604 Mbbl/d total Sep 2018: 574 Mbbl/d total Oct 2018: 551 Mbbl/d total Nov 2018: 573 Mbbl/d total Dec 2018: 490 Mbbl/d total Jan 2019: 541 Mbbl/d total Feb 2019: 537 Mbbl/d total Mar 2019: 507 Mbbl/d total Apr 2019: 461 Mbbl/d total May 2019: 564 Mbbl/d total Jun 2019: 577 Mbbl/d total Jul 2019: 573 Mbbl/d total Aug 2019: 544 Mbbl/d total Sep 2019: 549 Mbbl/d total Oct 2019: 510 Mbbl/d total Nov 2019: 539 Mbbl/d total Dec 2019: 539 Mbbl/d total Jan 2020: 484 Mbbl/d total Feb 2020: 456 Mbbl/d total Mar 2020: 486 Mbbl/d total Apr 2020: 482 Mbbl/d total May 2020: 480 Mbbl/d total Jun 2020: 474 Mbbl/d total Jul 2020: 479 Mbbl/d total Aug 2020: 321 Mbbl/d total Sep 2020: 383 Mbbl/d total Oct 2020: 335 Mbbl/d total Nov 2020: 570 Mbbl/d total Dec 2020: 588 Mbbl/d total Jan 2021: 581 Mbbl/d total Feb 2021: 513 Mbbl/d total Mar 2021: 553 Mbbl/d total Apr 2021: 572 Mbbl/d total May 2021: 571 Mbbl/d total Jun 2021: 536 Mbbl/d total Jul 2021: 544 Mbbl/d total Aug 2021: 321 Mbbl/d total Sep 2021: 452 Mbbl/d total Oct 2021: 554 Mbbl/d total Nov 2021: 543 Mbbl/d total Dec 2021: 480 Mbbl/d total Jan 2022: 490 Mbbl/d total Feb 2022: 517 Mbbl/d total Mar 2022: 540 Mbbl/d total Apr 2022: 520 Mbbl/d total May 2022: 460 Mbbl/d total Jun 2022: 367 Mbbl/d total Jul 2022: 455 Mbbl/d total Aug 2022: 521 Mbbl/d total Sep 2022: 465 Mbbl/d total Oct 2022: 478 Mbbl/d total Nov 2022: 545 Mbbl/d total Dec 2022: 510 Mbbl/d total Jan 2023: 514 Mbbl/d total Feb 2023: 548 Mbbl/d total Mar 2023: 500 Mbbl/d total Apr 2023: 509 Mbbl/d total May 2023: 501 Mbbl/d total Jun 2023: 525 Mbbl/d total Jul 2023: 562 Mbbl/d total Aug 2023: 569 Mbbl/d total Sep 2023: 318 Mbbl/d total Oct 2023: 338 Mbbl/d total Nov 2023: 572 Mbbl/d total Dec 2023: 566 Mbbl/d total Jan 2024: 524 Mbbl/d total Feb 2024: 561 Mbbl/d total Mar 2024: 596 Mbbl/d total Apr 2024: 608 Mbbl/d total May 2024: 452 Mbbl/d total Jun 2024: 463 Mbbl/d total Jul 2024: 512 Mbbl/d total Aug 2024: 596 Mbbl/d total Sep 2024: 549 Mbbl/d total Oct 2024: 544 Mbbl/d total Nov 2024: 570 Mbbl/d total Dec 2024: 642 Mbbl/d total Jan 2025: 606 Mbbl/d total Feb 2025: 523 Mbbl/d total Mar 2025: 613 Mbbl/d total Apr 2025: 546 Mbbl/d total May 2025: 472 Mbbl/d total Jun 2025: 474 Mbbl/d total Jul 2025: 548 Mbbl/d total Aug 2025: 557 Mbbl/d total Sep 2025: 595 Mbbl/d total Oct 2025: 565 Mbbl/d total Nov 2025: 610 Mbbl/d total Dec 2025: 630 Mbbl/d total Jan 2026: 597 Mbbl/d total Feb 2026: 546 Mbbl/d total Mar 2026: 569 Mbbl/d total Apr 2026: 528 Mbbl/d total May 2026: 405 Mbbl/d total Jun 2026: 285 Mbbl/d as filed so far. Filings for this month are still arriving. The chart shows what has been filed. Jul 2026: 296 Mbbl/d as filed so far. Filings for this month are still arriving. The chart shows what has been filed.

Still arriving: Aug 2026 <1% filed.

All from what the source published. 36.3% held at well grain.

How the volume breaks down
  • 36.3% Reported by the official source by well
  • 63.7% Reported by the official source as a lease, facility, field or state total. Published without per-well detail.

Every barrel here starts from what the official source published for the months measured. Measured over January 1962 to May 2026.

The gray “Reported without well detail” band is volume the source reports above the well: fields, facilities, or leases the source publishes as one total. It is included so the stack still sums to the whole entity.

Suncor Energy natural gas production (MMcf/d, monthly average, grouped by when each well first produced)
Suncor Energy natural gas production: million cubic feet per day, by first-production vintage as filed so far today 100200300400 MMcf/d 2017201820192020202120222023202420252026 Aug 2016: 219 MMcf/d total Sep 2016: 204 MMcf/d total Oct 2016: 195 MMcf/d total Nov 2016: 230 MMcf/d total Dec 2016: 213 MMcf/d total Jan 2017: 201 MMcf/d total Feb 2017: 171 MMcf/d total Mar 2017: 220 MMcf/d total Apr 2017: 133 MMcf/d total May 2017: 139 MMcf/d total Jun 2017: 220 MMcf/d total Jul 2017: 217 MMcf/d total Aug 2017: 14.5 MMcf/d total Sep 2017: 40 MMcf/d total Oct 2017: 178 MMcf/d total Nov 2017: 237 MMcf/d total Dec 2017: 154 MMcf/d total Jan 2018: 221 MMcf/d total Feb 2018: 254 MMcf/d total Mar 2018: 242 MMcf/d total Apr 2018: 239 MMcf/d total May 2018: 218 MMcf/d total Jun 2018: 189 MMcf/d total Jul 2018: 203 MMcf/d total Aug 2018: 10 MMcf/d total Sep 2018: 204 MMcf/d total Oct 2018: 168 MMcf/d total Nov 2018: 46.2 MMcf/d total Dec 2018: 179 MMcf/d total Jan 2019: 162 MMcf/d total Feb 2019: 212 MMcf/d total Mar 2019: 136 MMcf/d total Apr 2019: 138 MMcf/d total May 2019: 84.2 MMcf/d total Jun 2019: 205 MMcf/d total Jul 2019: 196 MMcf/d total Aug 2019: 217 MMcf/d total Sep 2019: 237 MMcf/d total Oct 2019: 82.4 MMcf/d total Nov 2019: 183 MMcf/d total Dec 2019: 145 MMcf/d total Jan 2020: 3.64 MMcf/d total Feb 2020: 3.53 MMcf/d total Mar 2020: 3.43 MMcf/d total Apr 2020: 3.75 MMcf/d total May 2020: 3.48 MMcf/d total Jun 2020: 3.73 MMcf/d total Jul 2020: 4.01 MMcf/d total Aug 2020: 3.54 MMcf/d total Sep 2020: 3.82 MMcf/d total Oct 2020: 3.03 MMcf/d total Nov 2020: 4.58 MMcf/d total Dec 2020: 5.53 MMcf/d total Jan 2021: 5.24 MMcf/d total Feb 2021: 5.57 MMcf/d total Mar 2021: 6.12 MMcf/d total Apr 2021: 5.83 MMcf/d total May 2021: 5.9 MMcf/d total Jun 2021: 5.41 MMcf/d total Jul 2021: 5.28 MMcf/d total Aug 2021: 4.58 MMcf/d total Sep 2021: 5.43 MMcf/d total Oct 2021: 5.57 MMcf/d total Nov 2021: 5.81 MMcf/d total Dec 2021: 5.29 MMcf/d total Jan 2022: 5.22 MMcf/d total Feb 2022: 5.32 MMcf/d total Mar 2022: 5.48 MMcf/d total Apr 2022: 5.32 MMcf/d total May 2022: 4.2 MMcf/d total Jun 2022: 1.77 MMcf/d total Jul 2022: 3.59 MMcf/d total Aug 2022: 5.27 MMcf/d total Sep 2022: 4.79 MMcf/d total Oct 2022: 4.15 MMcf/d total Nov 2022: 3.96 MMcf/d total Dec 2022: 3.97 MMcf/d total Jan 2023: 4.07 MMcf/d total Feb 2023: 4.52 MMcf/d total Mar 2023: 4.19 MMcf/d total Apr 2023: 3.47 MMcf/d total May 2023: 3.49 MMcf/d total Jun 2023: 3.5 MMcf/d total Jul 2023: 3.51 MMcf/d total Aug 2023: 3.55 MMcf/d total Sep 2023: 1.76 MMcf/d total Oct 2023: 3.56 MMcf/d total Nov 2023: 13.3 MMcf/d total Dec 2023: 42.8 MMcf/d total Jan 2024: 42.5 MMcf/d total Feb 2024: 139 MMcf/d total Mar 2024: 94.3 MMcf/d total Apr 2024: 180 MMcf/d total May 2024: 139 MMcf/d total Jun 2024: 73 MMcf/d total Jul 2024: 144 MMcf/d total Aug 2024: 199 MMcf/d total Sep 2024: 92.6 MMcf/d total Oct 2024: 130 MMcf/d total Nov 2024: 23.9 MMcf/d total Dec 2024: 219 MMcf/d total Jan 2025: 256 MMcf/d total Feb 2025: 171 MMcf/d total Mar 2025: 209 MMcf/d total Apr 2025: 46 MMcf/d total May 2025: 178 MMcf/d total Jun 2025: 50.1 MMcf/d total Jul 2025: 94.6 MMcf/d total Aug 2025: 213 MMcf/d total Sep 2025: 198 MMcf/d total Oct 2025: 256 MMcf/d total Nov 2025: 114 MMcf/d total Dec 2025: 249 MMcf/d total Jan 2026: 279 MMcf/d total Feb 2026: 270 MMcf/d total Mar 2026: 262 MMcf/d total Apr 2026: 298 MMcf/d total May 2026: 271 MMcf/d total Jun 2026: 78.8 MMcf/d as filed so far. Filings for this month are still arriving. The chart shows what has been filed. Jul 2026: 193 MMcf/d as filed so far. Filings for this month are still arriving. The chart shows what has been filed.

Still arriving: Aug 2026 <1% filed.

All from what the source published. 39.7% held at well grain.

How the volume breaks down
  • 39.7% Reported by the official source by well
  • 60.3% Reported by the official source as a lease, facility, field or state total. Published without per-well detail.

Every cubic foot here starts from what the official source published for the months measured. Measured over January 1962 to May 2026.

The gray “Reported without well detail” band is volume the source reports above the well: fields, facilities, or leases the source publishes as one total. It is included so the stack still sums to the whole entity.

The bands group wells by when they first produced.

About this chart

The stack shows what is holding today's rate up and how much of it is new drilling. The bands draw the filings already in.

These volumes are the production from the wells and facilities this company operates. Ownership works differently: other parties hold interests in these wells, and this company holds interests in wells that other companies operate. How we attribute production to a company

Annual table (full history)

best estimate incl. unsplit totals

YearOil (MMbbl)Gas produced (Bcf)
2025205.262
2024201.945
2023183.13
2022178.52
2021189.22
2020168.91
2019195.961
2018193.366
2017200.259
2016175.457
2015204.750
2014189.853
2013175.040
2012154.133
2011154.170
2010154.1112
2009159.3106
2008141.880
2007153.472
200626.434
200543.759
200445.065
200349.663
200239.448
20011.215
20001.418
19991.517
19981.519
19971.420
19961.521
19951.823
19941.722
19931.315
19921.113
19911.013
19900.911
19890.98
19880.88
19870.94
19860.73
19850.62
19840.73
19830.62
19820.63
19810.53
19800.53
19790.84
19781.26
19771.26
19761.37
19751.88
19742.09
19731.98
19721.67
19711.06
19701.05
19691.05
19680.85
19670.95
19660.84
19650.63
19640.53
19630.54
19620.54

Source: CommoVision (commovision.com)

Monthly table (last 24 months)
MonthOil (Mbbl)Gas produced (MMcf)
2026-0512,549.88,412
2026-0415,849.58,951
2026-0317,635.98,117
2026-0215,299.97,566
2026-0118,492.78,658
2025-1219,533.67,714
2025-1118,307.63,410
2025-1017,507.67,922
2025-0917,855.85,931
2025-0817,257.76,613
2025-0716,993.52,933
2025-0614,216.91,503
2025-0514,635.85,530
2025-0416,393.91,379
2025-0319,013.16,464
2025-0214,656.04,785
2025-0118,784.97,946
2024-1219,916.56,802
2024-1117,099.5717
2024-1016,863.24,044
2024-0916,474.32,777
2024-0818,488.66,160
2024-0715,886.34,474
2024-0613,896.02,189

Source: CommoVision (commovision.com)

Source: CommoVision · Suncor Energy, data through May 2026.

Well map

A map of 13,330 well locations operated by Suncor Energy for which CommoVision holds a published surface coordinate, each drawn where it is and colored by its primary product (green for oil, red for natural gas, gray where undetermined; a spot shared by more than one product shows the one with the most wells there), on a ground of land and water over faint state and province outlines and place names for orientation, with a small inset map locating this frame in the Americas.
  • Oil 998
  • Natural gas 6,980
  • Undetermined 5,352
13,330 well locations operated by Suncor Energy, colored by primary product.
About this map

Undetermined means not enough signal to settle it. Producing wells are the ones that reported oil or gas in the trailing 12 months per region.

404.8 Mbbl/d May 2026 oil production -14.3% vs May last year best estimate incl. unsplit totals
271.4 MMcf/d May 2026 gas production +52.1% vs May last year best estimate incl. unsplit totals
562.1 Mbbl/d 2025 oil production best estimate incl. unsplit totals
170.2 MMcf/d 2025 gas production best estimate incl. unsplit totals
507 wells Operated producing wells tracked trailing 12 months per region

Type curves

Suncor Energy oil type curves (bbl/d per well, log scale, against months on production; cohorts 2010–2026)
Suncor Energy oil type curves: average barrels per day per well on a log scale against months on production 2010-2014: 150 wells; starts at 198 bbl/d per well, 3,030 Mbbl cumulative through month 140 (100% of its wells old enough at that month); the dashed curve runs through month 200, on our forecast where a well’s own record ends2015: 36 wells; starts at 201 bbl/d per well, 2,239 Mbbl cumulative through month 128 (100% of its wells old enough at that month); the dashed curve runs through month 188, on our forecast where a well’s own record ends2016: 18 wells; starts at 79.1 bbl/d per well, 1,926 Mbbl cumulative through month 123 (100% of its wells old enough at that month); the dashed curve runs through month 183, on our forecast where a well’s own record ends2017: 29 wells; starts at 203 bbl/d per well, 1,924 Mbbl cumulative through month 104 (100% of its wells old enough at that month); the dashed curve runs through month 164, on our forecast where a well’s own record ends2018: 40 wells; starts at 170 bbl/d per well, 1,769 Mbbl cumulative through month 92 (100% of its wells old enough at that month); the dashed curve runs through month 152, on our forecast where a well’s own record ends2019: 29 wells; starts at 102 bbl/d per well, 1,657 Mbbl cumulative through month 80 (100% of its wells old enough at that month); the dashed curve runs through month 140, on our forecast where a well’s own record ends2020: 30 wells; starts at 175 bbl/d per well, 1,317 Mbbl cumulative through month 68 (100% of its wells old enough at that month); the dashed curve runs through month 128, on our forecast where a well’s own record ends2021: 37 wells; starts at 264 bbl/d per well, 1,151 Mbbl cumulative through month 57 (100% of its wells old enough at that month); the dashed curve runs through month 117, on our forecast where a well’s own record ends2022: 37 wells; starts at 340 bbl/d per well, 1,139 Mbbl cumulative through month 44 (100% of its wells old enough at that month); the dashed curve runs through month 104, on our forecast where a well’s own record ends2023: 38 wells; starts at 253 bbl/d per well, 767 Mbbl cumulative through month 32 (100% of its wells old enough at that month); the dashed curve runs through month 92, on our forecast where a well’s own record ends2024: 13 wells; starts at 175 bbl/d per well, 341 Mbbl cumulative through month 20 (100% of its wells old enough at that month); the dashed curve runs through month 80, on our forecast where a well’s own record ends2025: 37 wells; starts at 173 bbl/d per well, 114 Mbbl cumulative through month 8 (100% of its wells old enough at that month); the dashed curve runs through month 68, on our forecast where a well’s own record ends2026: 7 wells; starts at 221 bbl/d per well, 6.7 Mbbl cumulative through month 1 (100% of its wells old enough at that month); the dashed curve runs through month 61, on our forecast where a well’s own record ends501002005001,0001,500bbl/d24487296120144168192216Months on production
Suncor Energy natural gas type curves (Mcf/d per well, log scale, against months on production; cohorts 2010–2026)
Suncor Energy natural gas type curves: average thousand cubic feet per day per well on a log scale against months on production 2010-2014: 150 wells; starts at 1.1 Mcf/d per well, 0.0 Bcf cumulative through month 140 (100% of its wells old enough at that month); the dashed curve runs through month 200, on our forecast where a well’s own record ends2015: 36 wells; starts at 1.4 Mcf/d per well, 0.0 Bcf cumulative through month 128 (100% of its wells old enough at that month); the dashed curve runs through month 188, on our forecast where a well’s own record ends2016: 18 wells; starts at 0.8 Mcf/d per well, 0.0 Bcf cumulative through month 123 (100% of its wells old enough at that month); the dashed curve runs through month 183, on our forecast where a well’s own record ends2017: 29 wells; starts at 1.6 Mcf/d per well, 0.0 Bcf cumulative through month 104 (100% of its wells old enough at that month); the dashed curve runs through month 164, on our forecast where a well’s own record ends2018: 40 wells; starts at 2.5 Mcf/d per well, 0.0 Bcf cumulative through month 92 (100% of its wells old enough at that month); the dashed curve runs through month 152, on our forecast where a well’s own record ends2019: 29 wells; starts at 1.2 Mcf/d per well, 0.0 Bcf cumulative through month 80 (100% of its wells old enough at that month); the dashed curve runs through month 140, on our forecast where a well’s own record ends2020: 30 wells; starts at 3.1 Mcf/d per well, 0.0 Bcf cumulative through month 68 (100% of its wells old enough at that month); the dashed curve runs through month 128, on our forecast where a well’s own record ends2021: 37 wells; starts at 7.8 Mcf/d per well, 0.0 Bcf cumulative through month 57 (100% of its wells old enough at that month); the dashed curve runs through month 117, on our forecast where a well’s own record ends2022: 37 wells; starts at 7 Mcf/d per well, 0.0 Bcf cumulative through month 44 (100% of its wells old enough at that month); the dashed curve runs through month 104, on our forecast where a well’s own record ends2023: 38 wells; starts at 4 Mcf/d per well, 0.0 Bcf cumulative through month 32 (100% of its wells old enough at that month); the dashed curve runs through month 92, on our forecast where a well’s own record ends2024: 13 wells; starts at 4.3 Mcf/d per well, 0.0 Bcf cumulative through month 20 (100% of its wells old enough at that month); the dashed curve runs through month 80, on our forecast where a well’s own record ends2025: 37 wells; starts at 4.7 Mcf/d per well, 0.0 Bcf cumulative through month 8 (100% of its wells old enough at that month); the dashed curve runs through month 68, on our forecast where a well’s own record ends2026: 7 wells; starts at 6.4 Mcf/d per well, 0.0 Bcf cumulative through month 1 (100% of its wells old enough at that month); the dashed curve runs through month 61, on our forecast where a well’s own record ends0.7125102040Mcf/d24487296120144168192216Months on production

Horizontal wells only. Average production per well, for wells grouped by when they first produced.

How these curves are built

Horizontal wells only: 501 of the 512 wells in these cohorts. Average daily production per well, drawn against the cohort’s cumulative production per well on a log rate scale, for wells grouped by when they first produced. Includes every well of the cohort that is old enough at each month. Wells that are shut in or have stopped producing count as zero, so the average reflects the full cohort, not just survivors. Rates are calendar-day (volume ÷ days in month). The cumulative axis accumulates those same monthly averages at the average month length. Months not yet fully reported are excluded. The 2010-2014 curve draws those years as one group. The chart opens on average daily rate against months on production; the view control switches to rate against cumulative production per well (the log-rate form described above) or to cumulative production per well against months. Every view draws the same cohorts from the same production history. Each cohort is solid through the last month all of its wells sit inside fully reported data. Past it the dashed curve carries the same wells forward, on our forecast where a well’s own record ends, for up to five years. A dashed curve runs as far as at least nine in ten of its wells are accounted for. A well that is old enough but shut in still counts, as zero. The measured months are what these wells reported. In the forward months each well counts its own reported figure for each month it has one, our forecast for each month it has only that, and zero for the rest. The forward average counts every well of the cohort. The drawn forecast runs up to five years past the measured months. Line thickness tracks the size of each cohort.

Cohort summary table
First produced Wells Peak oil (bbl/d per well) Month-12 oil (bbl/d per well) Cum oil in series (Mbbl per well) Peak gas (Mcf/d per well) Month-12 gas (Mcf/d per well) Cum gas in series (Bcf per well) Months in series Wells old enough at last month in series Forecast months drawn
2026 7 221 6.7 6.4 0.0 1 100% 60
2025 37 646 114 17.8 0.0 8 100% 60
2024 13 796 779 341 26.6 24.7 0.0 20 100% 60
2023 38 1,040 805 767 33.8 19.4 0.0 32 100% 60
2022 37 1,110 845 1,139 36.3 14 0.0 44 100% 60
2021 37 825 679 1,151 21.7 12.7 0.0 57 100% 60
2020 30 767 525 1,317 22.3 11.6 0.0 68 100% 60
2019 29 851 525 1,657 25.9 9.7 0.0 80 100% 60
2018 40 848 575 1,769 20.7 10.1 0.0 92 100% 60
2017 29 931 619 1,924 18 7.3 0.0 104 100% 60
2016 18 709 503 1,926 16.3 6.2 0.0 123 100% 60
2015 36 779 741 2,239 17 8.4 0.0 128 100% 60
2010-2014 150 1,009 822 3,030 12.9 4.9 0.0 140 100% 60

Source: CommoVision (commovision.com)

Source: CommoVision · Suncor Energy type curves, per-well production by first-production cohort.

Recent permitting

219 permits approved in the 365 days to May 11, 2026
17 permits in the 90 days to May 11, 2026
17 new-well permits in the 90 days to May 11, 2026
May 11, 2026 latest approval on record
About this chart

Approvals of every permit type per month, the 24 months to May 2026. The last bar is May 2026 through May 11, 2026 (3 so far), drawn hatched. All 219 approved in the 365 days to May 11, 2026 are permits to drill a new well. Permits to drill a new well: 219 in the 365 days to May 11, 2026 and 17 in the last 90 days of that window. How permits are counted.

  • Suncor Energy was granted 219 well permits in the 365 days to May 11, 2026. Of those, 17 came in the last 90 days of that window. The latest approval on record is dated May 11, 2026.
  • All 219 approved in the 365 days to May 11, 2026 are permits to drill a new well. Permits to drill a new well: 219 in the 365 days to May 11, 2026 and 17 in the last 90 days of that window.
Well permits approved per month: full table
MonthPermits approved
May 2026 (through May 11, 2026)3
Apr 20260
Mar 20263
Feb 202611
Jan 20260
Dec 202535
Nov 2025141
Oct 202520
Sep 20250
Aug 20250
Jul 20250
Jun 20250
May 20256
Apr 20250
Mar 20250
Feb 20251
Jan 20250
Dec 20240
Nov 202477
Oct 202430
Sep 20240
Aug 202410
Jul 202423
Jun 202414

Source: CommoVision (commovision.com)

What we cover here

Each row names the grain a region’s production is held at. Where a source publishes at a coarser grain, the page says so.

DataGrainSinceBenchmark
Alberta production project + well 1962-01
British Columbia production well 1954-06
Colorado production well 1999-01 ~100% of EIA
Utah production well 1984-01 ~100% of EIA
Wyoming production well 1978-01 ~100–101% of EIA
Newfoundland & Labrador Offshore production field 2002-01

Benchmark cells compare our series with the EIA’s published estimates.

About the EIA comparison

The two are produced differently: the EIA estimates from a survey of the largest operators and a model built to anticipate late filings, while the series compared here are rebuilt from the source’s own records as they arrive. Recent months can differ without either being wrong; the methodology page explains both methods.

Coverage rows for Suncor Energy are regenerated at every build from the same catalog of sources the data is built from.

Top regions by 2025 operated production best estimate incl. unsplit totals

RegionOil (MMbbl)Gas produced (Bcf)Share of 2025 output
Alberta197.1394.3%
Newfoundland & Labrador Offshore859.15.7%

Share of output counts oil and gas together, gas at its market-value weight.

What the data shows

  • Suncor Energy produced 205.2 MMbbl of oil and 62.1 Bcf of natural gas in 2025.
  • Suncor Energy oil production reached its highest level on record in 2025 at 205.2 MMbbl.
  • Suncor Energy operated production across 6 reporting regions in 2 countries (Canada, United States) in our coverage.
  • 507 operated producing wells tracked, trailing 12 months per region.

Get early access

Watch supply move as soon as its sources publish, with forecasts on 1.1+ million producing wells. The portal, an API and MCP access for AI tools open on October 1, 2026.

Data use is subject to our Terms of Service.