
Supply area
Western Canada
The Western Canada footprint produced 1.78 Bbbl of oil and 7.93 Tcf of natural gas in 2025. 198,210 producing wells tracked, trailing 12 months per region.
- Oil production rose 3% in 2025 from 2024.
Production
- filling in (est. · missed) . Hatching marks our estimate of the volume still to be filed. That estimate draws on our own production forecast. A check on the forecast behind this estimate measured a miss. It updates as filings arrive
All from what the source published. 78.2% held at well grain.
How the volume breaks down
- 78.2% Reported by the official source by well
- 21.8% Reported by the official source as a lease, facility, field or state total. Published without per-well detail.
Every barrel through May 2026 starts from what the official source published for those months. Measured over January 1962 to May 2026.
The gray “without per-well detail” band is volume the source reports above the well: fields, facilities, or leases the source publishes as one total. It is included so the stack still sums to the whole entity.
- filling in (est. · unconfirmed) . Hatching marks our estimate of the volume still to be filed. That estimate draws on our own production forecast. This estimate is published unconfirmed. It updates as filings arrive
Still arriving: Jul 2026 79% filed, Aug 2026 <1% filed.
All from what the source published. All held at well grain.
How the volume breaks down
- 100% Reported by the official source by well
Every cubic foot through May 2026 starts from what the official source published for those months. Measured over January 1962 to May 2026.
The bands group wells by when they first produced.
About this chart
The stack shows what is holding today's rate up and how much of it is new drilling. In the reported months the bands draw the filings already in. The months still filling in are marked.
Annual table (full history)
best estimate incl. unsplit totals
| Year | Oil (MMbbl) | Gas produced (Bcf) |
|---|---|---|
| 2025 | 1,775.9 | 7,931 |
| 2024 | 1,725.9 | 7,704 |
| 2023 | 1,655.1 | 7,537 |
| 2022 | 1,612.8 | 7,346 |
| 2021 | 1,410.8 | 6,733 |
| 2020 | 1,310.5 | 6,451 |
| 2019 | 1,383.2 | 6,527 |
| 2018 | 1,364.4 | 6,671 |
| 2017 | 1,246.7 | 6,374 |
| 2016 | 1,139.9 | 6,252 |
| 2015 | 1,159.9 | 6,209 |
| 2014 | 1,095.8 | 6,043 |
| 2013 | 1,011.0 | 5,820 |
| 2012 | 947.2 | 5,788 |
| 2011 | 847.4 | 5,985 |
| 2010 | 785.2 | 5,941 |
| 2009 | 729.6 | 6,148 |
| 2008 | 689.7 | 6,566 |
| 2007 | 697.7 | 6,811 |
| 2006 | 402.8 | 6,948 |
| 2005 | 390.0 | 6,913 |
| 2004 | 381.7 | 6,888 |
| 2003 | 378.7 | 6,784 |
| 2002 | 375.9 | 7,017 |
| 2001 | 399.3 | 7,053 |
| 2000 | 402.7 | 6,969 |
| 1999 | 397.6 | 6,959 |
| 1998 | 440.0 | 6,860 |
| 1997 | 444.4 | 6,695 |
| 1996 | 425.9 | 6,577 |
| 1995 | 422.6 | 6,383 |
| 1994 | 415.7 | 6,162 |
| 1993 | 410.2 | 5,804 |
| 1992 | 399.2 | 5,317 |
| 1991 | 390.3 | 4,862 |
| 1990 | 400.7 | 4,661 |
| 1989 | 410.5 | 4,634 |
| 1988 | 427.4 | 4,479 |
| 1987 | 407.6 | 3,962 |
| 1986 | 386.3 | 3,698 |
| 1985 | 396.2 | 3,823 |
| 1984 | 407.3 | 3,580 |
| 1983 | 374.8 | 3,365 |
| 1982 | 366.3 | 3,475 |
| 1981 | 379.9 | 3,436 |
| 1980 | 417.4 | 3,472 |
| 1979 | 451.8 | 3,707 |
| 1978 | 396.7 | 3,493 |
| 1977 | 401.4 | 3,568 |
| 1976 | 404.9 | 3,423 |
| 1975 | 444.6 | 3,404 |
| 1974 | 521.7 | 3,397 |
| 1973 | 549.3 | 3,449 |
| 1972 | 454.5 | 3,204 |
| 1971 | 388.4 | 2,729 |
| 1970 | 361.7 | 2,532 |
| 1969 | 319.0 | 2,213 |
| 1968 | 289.3 | 1,923 |
| 1967 | 268.0 | 1,708 |
| 1966 | 234.1 | 1,541 |
| 1965 | 207.2 | 1,446 |
| 1964 | 192.0 | 1,310 |
| 1963 | 187.8 | 1,128 |
| 1962 | 184.1 | 954 |
Source: CommoVision (commovision.com)
Monthly table (last 24 months)
| Month | Oil (Mbbl) | Gas produced (MMcf) |
|---|---|---|
| 2026-05 | 145,765.1 | 665,673 |
| 2026-04 | 146,801.1 | 674,895 |
| 2026-03 | 152,257.2 | 706,434 |
| 2026-02 | 136,551.9 | 652,061 |
| 2026-01 | 153,309.1 | 719,288 |
| 2025-12 | 158,990.4 | 702,545 |
| 2025-11 | 153,815.8 | 686,203 |
| 2025-10 | 150,820.0 | 672,835 |
| 2025-09 | 147,749.0 | 618,201 |
| 2025-08 | 153,346.2 | 648,359 |
| 2025-07 | 155,498.3 | 664,240 |
| 2025-06 | 142,262.2 | 626,709 |
| 2025-05 | 132,901.9 | 666,959 |
| 2025-04 | 142,208.0 | 648,367 |
| 2025-03 | 153,081.0 | 686,647 |
| 2025-02 | 132,503.6 | 617,357 |
| 2025-01 | 152,684.3 | 692,473 |
| 2024-12 | 155,334.8 | 694,576 |
| 2024-11 | 148,677.8 | 660,677 |
| 2024-10 | 150,512.9 | 654,076 |
| 2024-09 | 137,080.4 | 593,900 |
| 2024-08 | 148,553.4 | 643,176 |
| 2024-07 | 146,270.4 | 625,192 |
| 2024-06 | 138,278.0 | 618,800 |
Source: CommoVision (commovision.com)
Source: CommoVision · Western Canada, data through July 2026.
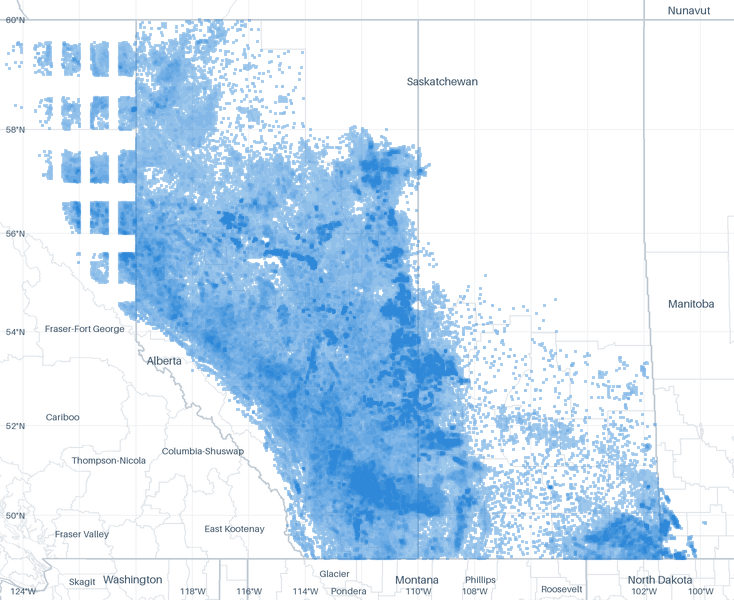
Well map
- Oil 259,621
- Natural gas 341,788
- Undetermined 73,452
About this map
Undetermined means not enough signal to settle it. Producing wells are the ones that reported oil or gas in the trailing 12 months per region.
Type curves
Horizontal wells only. Average production per well, for wells grouped by when they first produced.
How these curves are built
Horizontal wells only: 56,910 of the 79,223 wells in these cohorts. Average daily production per well, for wells grouped by when they first produced. Includes every well of the cohort that is old enough at each month. Wells that are shut in or have stopped producing count as zero, so the average reflects the full cohort, not just survivors. Rates are calendar-day (volume ÷ days in month). The cumulative axis accumulates those same monthly averages at the average month length. Months not yet fully reported are excluded. The 2010-2014 curve draws those years as one group. The chart opens on average daily rate against months on production, the rate on a log scale. The view control switches to rate against cumulative production per well, on the same log rate scale, or to cumulative production per well against months on production, on a linear scale. Every view draws the same cohorts from the same production history. Each cohort is solid through the last month all of its wells sit inside fully reported data. Past it the dashed curve carries the same wells forward, on our forecast where a well’s own record ends, for up to five years. A dashed curve runs as far as at least nine in ten of its wells are accounted for. A well that is old enough but shut in still counts, as zero. The measured months are what these wells reported. In the forward months each well counts its own reported figure for each month it has one, our forecast for each month it has only that, and zero for the rest. The forward average counts every well of the cohort. The drawn forecast runs up to five years past the measured months. Line thickness tracks the size of each cohort. 73 wells are counted here but not shown on the age axis: they started producing in 1964 or earlier, too close to the start of our records for their region to verify their true age.
Cohort summary table
| First produced | Wells | Peak oil (bbl/d per well) | Month-12 oil (bbl/d per well) | Cum oil in series (Mbbl per well) | Peak gas (Mcf/d per well) | Month-12 gas (Mcf/d per well) | Cum gas in series (Bcf per well) | Months in series | Wells old enough at last month in series | Forecast months drawn |
|---|---|---|---|---|---|---|---|---|---|---|
| 2026 | 1,802 | 105 | — | 3.2 | 1,035 | — | 0.0 | 1 | 100% | 60 |
| 2025 | 3,489 | 200 | — | 43.2 | 2,025 | — | 0.4 | 8 | 100% | 60 |
| 2024 | 3,664 | 196 | 129 | 85.4 | 1,990 | 1,204 | 0.8 | 20 | 100% | 60 |
| 2023 | 3,485 | 182 | 125 | 115 | 1,900 | 1,148 | 1.0 | 32 | 100% | 60 |
| 2022 | 3,497 | 170 | 106 | 119 | 1,949 | 1,100 | 1.2 | 44 | 100% | 60 |
| 2021 | 2,840 | 174 | 119 | 161 | 2,233 | 1,409 | 1.6 | 56 | 100% | 60 |
| 2020 | 1,797 | 154 | 127 | 189 | 2,062 | 1,218 | 1.5 | 68 | 100% | 60 |
| 2019 | 2,916 | 170 | 121 | 191 | 1,382 | 930 | 1.2 | 80 | 100% | 60 |
| 2018 | 3,459 | 154 | 88.5 | 158 | 1,512 | 1,002 | 1.4 | 92 | 100% | 60 |
| 2017 | 3,625 | 126 | 94.1 | 162 | 1,659 | 1,001 | 1.5 | 104 | 100% | 60 |
| 2016 | 2,010 | 147 | 133 | 271 | 1,760 | 1,122 | 1.8 | 116 | 100% | 60 |
| 2015 | 3,127 | 111 | 110 | 279 | 1,399 | 988 | 1.6 | 128 | 100% | 60 |
| 2010-2014 | 21,199 | 97 | 64 | 130 | 781 | 508 | 0.9 | 140 | 100% | 60 |
Source: CommoVision (commovision.com)
Source: CommoVision · Western Canada type curves, per-well production by first-production cohort.
Top operators in Western Canada, 2025 best estimate incl. unsplit totals
Top operators in Western Canada, 2025: full table
| Operator | Oil (Mbbl/d, 2025) | Gas produced (MMcf/d, 2025) | Share of output |
|---|---|---|---|
| Canadian Natural Resources | 1,107.6 | 3,042.7 | 20.8% |
| Cenovus Energy | 640.2 | 852.4 | 11.0% |
| Suncor Energy | 540.0 | 8.3 | 8.6% |
| Imperial Oil | 454.2 | 37.7 | 7.2% |
| Syncrude Canada Ltd. | 382.9 | 0.0 | 6.1% |
| Tourmaline Oil Corp | 17.9 | 3,314.7 | 3.8% |
| Whitecap Resources | 150.1 | 891.8 | 3.3% |
| Fort Hills Energy Corporation | 183.1 | 0.0 | 2.9% |
| Arc Resources | 72.6 | 1,482.3 | 2.7% |
| Ovintiv | 15.4 | 2,200.0 | 2.6% |
| 541 other operators | 1,301.3 | 9,898.5 | 31.1% |
Mbbl/d = thousand barrels per day · MMcf/d = million cubic feet per day (units).
Source: CommoVision (commovision.com)
Recent permitting
About this chart
Approvals of every permit type per month, the 24 months to Sep 2026. The last bar is Sep 2026 through September 1, 2026 (29 so far), drawn hatched. All 5,532 approved in the 365 days to September 1, 2026 are permits to drill a new well. Permits to drill a new well: 5,532 in the 365 days to September 1, 2026 and 1,240 in the last 90 days of that window. How permits are counted.
Most permits 365 days to September 1, 2026
- In the Western Canada footprint, 5,532 well permits were approved in the 365 days to September 1, 2026. Of those, 1,240 came in the last 90 days of that window. The latest approval on record is dated September 1, 2026.
- All 5,532 approved in the 365 days to September 1, 2026 are permits to drill a new well. Permits to drill a new well: 5,532 in the 365 days to September 1, 2026 and 1,240 in the last 90 days of that window.
- Permits counted here come from Alberta and British Columbia.
- Manitoba and Saskatchewan reach this page through production data alone.
Well permits approved per month: full table
| Month | Permits approved |
|---|---|
| Sep 2026 (through September 1, 2026) | 29 |
| Aug 2026 | 383 |
| Jul 2026 | 495 |
| Jun 2026 | 424 |
| May 2026 | 463 |
| Apr 2026 | 335 |
| Mar 2026 | 421 |
| Feb 2026 | 273 |
| Jan 2026 | 327 |
| Dec 2025 | 662 |
| Nov 2025 | 821 |
| Oct 2025 | 431 |
| Sep 2025 | 468 |
| Aug 2025 | 313 |
| Jul 2025 | 369 |
| Jun 2025 | 345 |
| May 2025 | 414 |
| Apr 2025 | 265 |
| Mar 2025 | 310 |
| Feb 2025 | 395 |
| Jan 2025 | 480 |
| Dec 2024 | 417 |
| Nov 2024 | 699 |
| Oct 2024 | 474 |
Source: CommoVision (commovision.com)
Active drilling rigs
Interactive chart. Focus it and use the left and right arrow keys to read each week, Page Up and Page Down to move a year, Home and End for the ends of the series. The full figures are also in the table below.
- In Western Canada, 204 drilling rigs were active in the week to September 11, 2026 (20 more than a year earlier).
- Since Sep 2016, the weekly count peaked at 512 in Jan 2025.
- Rig locations are reported by county and rolled up to this supply area's footprint; each county counts toward exactly one area.
Average active rigs per month: full table
| Month | Oil-directed | Gas-directed | Miscellaneous | All rigs |
|---|---|---|---|---|
| Sep 2026 (through September 11, 2026) | 139 | 64 | 1 | 204 |
| Aug 2026 | 144 | 64 | 3.4 | 211.4 |
| Jul 2026 | 134 | 60.2 | 4.2 | 198.5 |
| Jun 2026 | 124.2 | 56.8 | 1.2 | 182.2 |
| May 2026 | 85.2 | 49 | 0.8 | 135 |
| Apr 2026 | 76 | 51.5 | 0 | 127.5 |
| Mar 2026 | 111.6 | 61 | 0.4 | 173 |
| Feb 2026 | 150.8 | 70.5 | 0.2 | 221.5 |
| Jan 2026 | 146.5 | 73.5 | 0 | 220 |
| Dec 2025 | 94.2 | 62.2 | 0 | 156.4 |
| Nov 2025 | 124 | 65 | 0 | 189 |
| Oct 2025 | 131.8 | 61.2 | 0.5 | 193.5 |
| Sep 2025 | 125.4 | 59.4 | 0.8 | 185.6 |
| Aug 2025 | 242 | 112.5 | 1 | 355.5 |
| Jul 2025 | 240 | 104.5 | 0 | 344.5 |
| Jun 2025 | 177.2 | 93.2 | 0 | 270.4 |
| May 2025 | 137.5 | 89.5 | 0 | 227 |
| Apr 2025 | 164.5 | 93.5 | 0 | 258 |
| Mar 2025 | 250.4 | 117.2 | 0.8 | 368.4 |
| Feb 2025 | 347 | 142 | 0 | 489 |
| Jan 2025 | 326 | 144 | 0 | 470 |
| Dec 2024 | 172.8 | 119.2 | 0 | 292 |
| Nov 2024 | 269 | 132.5 | 1 | 402.5 |
| Oct 2024 | 297.5 | 131 | 0 | 428.5 |
Source: CommoVision (commovision.com)
Formations
One cross-section through the Western Canada Sedimentary Basin, drawn across Alberta.
10 formations along a 91-mile line, south-southwest to north-northeast.
Every depth drawn here is our own estimate, built from the curated formation tops of Alberta wells across the basin. The pale ribbon along each boundary shows how certain that depth is. Where the ribbon is wider, the depth is less certain.
How these sections are built
The section follows one straight line across the basin, and the map beside it shows where that line runs.
West is on the left.
The depth of each formation along the line is estimated from the depths at which Alberta wells across the basin met that formation, as picked well by well by the official source.
A formation is drawn where enough wells along the line place it and where it stands clear of the formation above or below.
Key numbers
What we cover here
Each row names the grain a region’s production is held at. Where a source publishes at a coarser grain, the page says so.
| Data | Grain | Since | Benchmark |
|---|---|---|---|
| Alberta production | project + well | 1962-01 | — |
| British Columbia production | well | 1954-06 | — |
| Manitoba production | well | 1951-02 | — |
| Saskatchewan production | well | 2022-01 | — |
Coverage rows for Western Canada are regenerated at every build from the same catalog of sources the data is built from.
What the data shows
- The Western Canada footprint produced 1.78 Bbbl of oil and 7.93 Tcf of natural gas in 2025.
- Oil production in the Western Canada footprint reached its highest level on record in 2025 at 1.78 Bbbl.
- Western Canada is a producing area, not a single rock target: the 674,868 wells here are grouped by where they are, across every formation and trajectory drilled inside it.
- The figures here start in 1962, when Alberta filings begin. Before that only Manitoba and British Columbia report, together 10% of the area's volume at that point, so the earlier years are not drawn as the whole area. Saskatchewan from 2022 (8% of the area at that point) is included from its own first year.
- 198,210 producing wells tracked, trailing 12 months per region.
Get early access
Watch supply move as soon as its sources publish, with forecasts on 1.1+ million producing wells. The portal, an API and MCP access for AI tools open on October 1, 2026.
Data use is subject to our Terms of Service.