CommoVision

See the future in real time

Operator

Arc Resources

Arc Resources produced 26.5 MMbbl of oil and 541.0 Bcf of natural gas in 2025. 2,405 operated producing wells tracked, trailing 12 months per region.

  • Sixth-largest operator by operated natural gas in Alberta, 2025.
  • Operated 5.1% of the natural gas produced in Alberta, 2025.
  • Natural gas production rose 3% in 2025 from 2024.
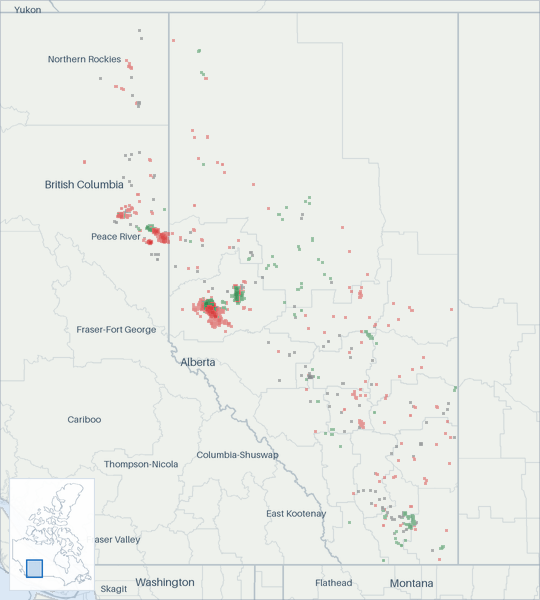
Well map of Arc Resources. The full map is further down this page.

Production

Arc Resources natural gas production (Bcf/d, monthly average, grouped by when each well first produced)
  • filling in (est.) . Months in the hatched zone are partly reported. The part not yet filed is estimated from recent production rates. It updates as filings arrive
  • estimated . Hatching marks our estimate. In the most recent months that is volume still to be filed. Past the divider it is our forecast.
Arc Resources natural gas production: billion cubic feet per day, by first-production vintage filed in full today 0.511.52 Bcf/d 2017201820192020202120222023202420252026 Aug 2016: 0.56 Bcf/d total Sep 2016: 0.52 Bcf/d total Oct 2016: 0.53 Bcf/d total Nov 2016: 0.54 Bcf/d total Dec 2016: 0.55 Bcf/d total Jan 2017: 0.59 Bcf/d total Feb 2017: 0.58 Bcf/d total Mar 2017: 0.58 Bcf/d total Apr 2017: 0.58 Bcf/d total May 2017: 0.58 Bcf/d total Jun 2017: 0.62 Bcf/d total Jul 2017: 0.63 Bcf/d total Aug 2017: 0.64 Bcf/d total Sep 2017: 0.7 Bcf/d total Oct 2017: 0.68 Bcf/d total Nov 2017: 0.73 Bcf/d total Dec 2017: 0.78 Bcf/d total Jan 2018: 0.77 Bcf/d total Feb 2018: 0.77 Bcf/d total Mar 2018: 0.78 Bcf/d total Apr 2018: 0.76 Bcf/d total May 2018: 0.72 Bcf/d total Jun 2018: 0.78 Bcf/d total Jul 2018: 0.77 Bcf/d total Aug 2018: 0.81 Bcf/d total Sep 2018: 0.82 Bcf/d total Oct 2018: 0.83 Bcf/d total Nov 2018: 0.83 Bcf/d total Dec 2018: 0.86 Bcf/d total Jan 2019: 0.81 Bcf/d total Feb 2019: 0.82 Bcf/d total Mar 2019: 0.84 Bcf/d total Apr 2019: 0.85 Bcf/d total May 2019: 0.73 Bcf/d total Jun 2019: 0.79 Bcf/d total Jul 2019: 0.8 Bcf/d total Aug 2019: 0.8 Bcf/d total Sep 2019: 0.7 Bcf/d total Oct 2019: 0.81 Bcf/d total Nov 2019: 0.85 Bcf/d total Dec 2019: 0.84 Bcf/d total Jan 2020: 0.86 Bcf/d total Feb 2020: 0.88 Bcf/d total Mar 2020: 0.88 Bcf/d total Apr 2020: 0.97 Bcf/d total May 2020: 0.97 Bcf/d total Jun 2020: 0.95 Bcf/d total Jul 2020: 0.94 Bcf/d total Aug 2020: 0.87 Bcf/d total Sep 2020: 0.82 Bcf/d total Oct 2020: 0.91 Bcf/d total Nov 2020: 1.03 Bcf/d total Dec 2020: 1.04 Bcf/d total Jan 2021: 1.05 Bcf/d total Feb 2021: 1.04 Bcf/d total Mar 2021: 1.04 Bcf/d total Apr 2021: 1.05 Bcf/d total May 2021: 0.97 Bcf/d total Jun 2021: 0.97 Bcf/d total Jul 2021: 1.54 Bcf/d total Aug 2021: 1.54 Bcf/d total Sep 2021: 1.5 Bcf/d total Oct 2021: 1.49 Bcf/d total Nov 2021: 1.52 Bcf/d total Dec 2021: 1.48 Bcf/d total Jan 2022: 1.43 Bcf/d total Feb 2022: 1.42 Bcf/d total Mar 2022: 1.43 Bcf/d total Apr 2022: 1.44 Bcf/d total May 2022: 1.41 Bcf/d total Jun 2022: 1.26 Bcf/d total Jul 2022: 1.41 Bcf/d total Aug 2022: 1.41 Bcf/d total Sep 2022: 1.32 Bcf/d total Oct 2022: 1.45 Bcf/d total Nov 2022: 1.49 Bcf/d total Dec 2022: 1.47 Bcf/d total Jan 2023: 1.39 Bcf/d total Feb 2023: 1.44 Bcf/d total Mar 2023: 1.49 Bcf/d total Apr 2023: 1.44 Bcf/d total May 2023: 1.46 Bcf/d total Jun 2023: 1.48 Bcf/d total Jul 2023: 1.52 Bcf/d total Aug 2023: 1.53 Bcf/d total Sep 2023: 1.46 Bcf/d total Oct 2023: 1.5 Bcf/d total Nov 2023: 1.52 Bcf/d total Dec 2023: 1.56 Bcf/d total Jan 2024: 1.46 Bcf/d total Feb 2024: 1.49 Bcf/d total Mar 2024: 1.47 Bcf/d total Apr 2024: 1.47 Bcf/d total May 2024: 1.35 Bcf/d total Jun 2024: 1.43 Bcf/d total Jul 2024: 1.32 Bcf/d total Aug 2024: 1.31 Bcf/d total Sep 2024: 1.3 Bcf/d total Oct 2024: 1.46 Bcf/d total Nov 2024: 1.55 Bcf/d total Dec 2024: 1.63 Bcf/d total Jan 2025: 1.6 Bcf/d total Feb 2025: 1.58 Bcf/d total Mar 2025: 1.58 Bcf/d total Apr 2025: 1.5 Bcf/d total May 2025: 1.48 Bcf/d total Jun 2025: 1.39 Bcf/d total Jul 2025: 1.37 Bcf/d total Aug 2025: 1.27 Bcf/d total Sep 2025: 1.26 Bcf/d total Oct 2025: 1.43 Bcf/d total Nov 2025: 1.65 Bcf/d total Dec 2025: 1.69 Bcf/d total Jan 2026: 1.72 Bcf/d total Feb 2026: 1.74 Bcf/d total Mar 2026: 1.69 Bcf/d total Apr 2026: 1.7 Bcf/d total May 2026: 1.44 Bcf/d total Jun 2026: 1.65 Bcf/d total Jul 2026: ≈1.67 Bcf/d total (100% arrived, remainder estimated)

Still arriving: Aug 2026 <1% filed.

In this view, hatching marks our estimate, and in the most recent months that is volume still to be filed. Past the divider, the chart continues only the bands it has drawn. Each band continues as our forecast, built by summing our per-well forecasts. The method behind each well is recorded with the forecast. The forward months add no new wells. How our methods work

All from what the source published. All held at well grain.

How the volume breaks down
  • 100% Reported by the official source by well

Every cubic foot through June 2026 starts from what the official source published for those months. Measured over January 1962 to June 2026.

Arc Resources oil production (Mbbl/d, monthly average, grouped by when each well first produced)
  • filling in (est.) . Months in the hatched zone are partly reported. The part not yet filed is estimated from recent production rates. It updates as filings arrive
Arc Resources oil production: thousand barrels per day, by first-production vintage today 255075100 Mbbl/d 2017201820192020202120222023202420252026 Aug 2016: 24.1 Mbbl/d total Sep 2016: 20.1 Mbbl/d total Oct 2016: 24.5 Mbbl/d total Nov 2016: 24.4 Mbbl/d total Dec 2016: 26 Mbbl/d total Jan 2017: 25.2 Mbbl/d total Feb 2017: 23.3 Mbbl/d total Mar 2017: 23.5 Mbbl/d total Apr 2017: 23 Mbbl/d total May 2017: 26 Mbbl/d total Jun 2017: 25.7 Mbbl/d total Jul 2017: 26.7 Mbbl/d total Aug 2017: 27.9 Mbbl/d total Sep 2017: 31.1 Mbbl/d total Oct 2017: 28.8 Mbbl/d total Nov 2017: 30.7 Mbbl/d total Dec 2017: 29.2 Mbbl/d total Jan 2018: 27.8 Mbbl/d total Feb 2018: 29.1 Mbbl/d total Mar 2018: 34.9 Mbbl/d total Apr 2018: 37.2 Mbbl/d total May 2018: 40.3 Mbbl/d total Jun 2018: 45.9 Mbbl/d total Jul 2018: 49.1 Mbbl/d total Aug 2018: 49.6 Mbbl/d total Sep 2018: 42.3 Mbbl/d total Oct 2018: 41.3 Mbbl/d total Nov 2018: 38.7 Mbbl/d total Dec 2018: 37.1 Mbbl/d total Jan 2019: 34.4 Mbbl/d total Feb 2019: 33.4 Mbbl/d total Mar 2019: 34.7 Mbbl/d total Apr 2019: 37.8 Mbbl/d total May 2019: 36.7 Mbbl/d total Jun 2019: 34.3 Mbbl/d total Jul 2019: 33.8 Mbbl/d total Aug 2019: 32.9 Mbbl/d total Sep 2019: 29.8 Mbbl/d total Oct 2019: 30.7 Mbbl/d total Nov 2019: 30.9 Mbbl/d total Dec 2019: 30 Mbbl/d total Jan 2020: 29.3 Mbbl/d total Feb 2020: 31.1 Mbbl/d total Mar 2020: 32.2 Mbbl/d total Apr 2020: 28.3 Mbbl/d total May 2020: 25.8 Mbbl/d total Jun 2020: 26.6 Mbbl/d total Jul 2020: 26.7 Mbbl/d total Aug 2020: 26.5 Mbbl/d total Sep 2020: 25.2 Mbbl/d total Oct 2020: 28 Mbbl/d total Nov 2020: 28.8 Mbbl/d total Dec 2020: 29.2 Mbbl/d total Jan 2021: 27.2 Mbbl/d total Feb 2021: 24.9 Mbbl/d total Mar 2021: 24.9 Mbbl/d total Apr 2021: 25 Mbbl/d total May 2021: 23.2 Mbbl/d total Jun 2021: 29.6 Mbbl/d total Jul 2021: 80.8 Mbbl/d total Aug 2021: 79.2 Mbbl/d total Sep 2021: 67.9 Mbbl/d total Oct 2021: 70.8 Mbbl/d total Nov 2021: 68.7 Mbbl/d total Dec 2021: 64.8 Mbbl/d total Jan 2022: 62.5 Mbbl/d total Feb 2022: 65.1 Mbbl/d total Mar 2022: 64.9 Mbbl/d total Apr 2022: 70.8 Mbbl/d total May 2022: 68.9 Mbbl/d total Jun 2022: 69.8 Mbbl/d total Jul 2022: 71.7 Mbbl/d total Aug 2022: 76.5 Mbbl/d total Sep 2022: 74.4 Mbbl/d total Oct 2022: 75.4 Mbbl/d total Nov 2022: 78.1 Mbbl/d total Dec 2022: 69.7 Mbbl/d total Jan 2023: 64.6 Mbbl/d total Feb 2023: 67.1 Mbbl/d total Mar 2023: 67.2 Mbbl/d total Apr 2023: 66.7 Mbbl/d total May 2023: 70.3 Mbbl/d total Jun 2023: 70.1 Mbbl/d total Jul 2023: 69.7 Mbbl/d total Aug 2023: 72.4 Mbbl/d total Sep 2023: 69.8 Mbbl/d total Oct 2023: 69.3 Mbbl/d total Nov 2023: 67.1 Mbbl/d total Dec 2023: 71.5 Mbbl/d total Jan 2024: 67.1 Mbbl/d total Feb 2024: 70.3 Mbbl/d total Mar 2024: 65.1 Mbbl/d total Apr 2024: 61.9 Mbbl/d total May 2024: 57.2 Mbbl/d total Jun 2024: 59.7 Mbbl/d total Jul 2024: 66.7 Mbbl/d total Aug 2024: 76.7 Mbbl/d total Sep 2024: 74.2 Mbbl/d total Oct 2024: 84.6 Mbbl/d total Nov 2024: 77.2 Mbbl/d total Dec 2024: 70 Mbbl/d total Jan 2025: 63.9 Mbbl/d total Feb 2025: 64.1 Mbbl/d total Mar 2025: 65.4 Mbbl/d total Apr 2025: 75.3 Mbbl/d total May 2025: 74.4 Mbbl/d total Jun 2025: 68.7 Mbbl/d total Jul 2025: 73.4 Mbbl/d total Aug 2025: 73.7 Mbbl/d total Sep 2025: 75.1 Mbbl/d total Oct 2025: 75.7 Mbbl/d total Nov 2025: 81.2 Mbbl/d total Dec 2025: 79.7 Mbbl/d total Jan 2026: 74.9 Mbbl/d total Feb 2026: 73.3 Mbbl/d total Mar 2026: 65.5 Mbbl/d total Apr 2026: 70.4 Mbbl/d total May 2026: 70.3 Mbbl/d total Jun 2026: 76.7 Mbbl/d total Jul 2026: ≈70.4 Mbbl/d total (100% arrived, remainder estimated)

Still arriving: Aug 2026 <1% filed.

The most recent months are still filling in. The chart updates as filings arrive.

All from what the source published. All held at well grain.

How the volume breaks down
  • 100% Reported by the official source by well

Every barrel through June 2026 starts from what the official source published for those months. Measured over January 1962 to June 2026.

The bands group wells by when they first produced.

About this chart

The stack shows what is holding today's rate up and how much of it is new drilling. In the reported months the bands draw the filings already in. The months still filling in are marked.

These volumes are the production from the wells and facilities this company operates. Ownership works differently: other parties hold interests in these wells, and this company holds interests in wells that other companies operate. How we attribute production to a company

Annual table (full history)
YearOil (MMbbl)Gas produced (Bcf)
202526.5541
202425.3526
202325.1542
202225.8515
202117.9462
202010.3338
201912.1293
201814.4289
20179.8234
20169.5198
20159.2182
20149.3154
20138.5124
20127.8120
20116.6101
20106.386
20096.071
20086.166
20076.156
20066.148
20053.643
20043.544
20033.042
20022.733
20012.726
20002.623
19992.521
19982.622
19972.323
19962.220
19952.321
19942.216
19932.215
19922.314
19912.416
19902.418
19892.620
19882.716
19872.712
19862.610
19852.812
19843.210
19832.99
19823.09
19813.310
19803.711
19793.913
19784.015
19774.315
19764.611
19754.99
19745.88
19736.58
19726.46
19716.46
19705.96
19695.09
19684.46
19674.25
19664.06
19654.06
19644.36
19634.25
19624.46

Source: CommoVision (commovision.com)

Monthly table (last 24 months)
MonthOil (Mbbl)Gas produced (MMcf)
2026-052,178.644,619
2026-042,112.550,955
2026-032,031.052,230
2026-022,051.148,706
2026-012,320.453,193
2025-122,471.852,232
2025-112,437.249,476
2025-102,345.444,366
2025-092,252.537,921
2025-082,283.939,513
2025-072,276.642,386
2025-062,060.441,579
2025-052,307.746,000
2025-042,259.144,946
2025-032,028.848,803
2025-021,794.844,243
2025-011,979.449,579
2024-122,171.450,612
2024-112,316.846,636
2024-102,623.445,103
2024-092,224.539,092
2024-082,377.140,637
2024-072,066.840,979
2024-061,791.342,897

Source: CommoVision (commovision.com)

Source: CommoVision · Arc Resources, data through July 2026.

Well map

A map of 4,222 well locations operated by Arc Resources for which CommoVision holds a published surface coordinate, each drawn where it is and colored by its primary product (green for oil, red for natural gas, gray where undetermined; a spot shared by more than one product shows the one with the most wells there), on a ground of land and water over faint state, province, county and census-division outlines and place names for orientation, with a small inset map locating this frame in Canada.
  • Oil 1,081
  • Natural gas 2,635
  • Undetermined 506
4,222 well locations operated by Arc Resources, colored by primary product.
About this map

Undetermined means not enough signal to settle it. Producing wells are the ones that reported oil or gas in the trailing 12 months per region.

70.3 Mbbl/d May 2026 oil production -5.6% vs May last year
1.44 Bcf/d May 2026 gas production -3% vs May last year
72.6 Mbbl/d 2025 oil production
1.48 Bcf/d 2025 gas production
2,405 wells Operated producing wells tracked trailing 12 months per region
57.1 Mbbl/d Existing wells, Jul 2027 forecast Our forecast for existing wells.
1.2 Bcf/d Existing wells, Jul 2027 forecast Our forecast for existing wells.

Type curves

Arc Resources natural gas type curves (Mcf/d per well, log scale, against months on production; cohorts 2010–2026)
Arc Resources natural gas type curves: average thousand cubic feet per day per well on a log scale against months on production 2010-2014: 480 wells; starts at 1,099 Mcf/d per well, 2.9 Bcf cumulative through month 140 (100% of its wells old enough at that month); the dashed curve runs through month 200, on our forecast where a well’s own record ends2015: 188 wells; starts at 849 Mcf/d per well, 2.9 Bcf cumulative through month 128 (100% of its wells old enough at that month); the dashed curve runs through month 188, on our forecast where a well’s own record ends2016: 105 wells; starts at 812 Mcf/d per well, 3.2 Bcf cumulative through month 116 (100% of its wells old enough at that month); the dashed curve runs through month 176, on our forecast where a well’s own record ends2017: 180 wells; starts at 1,523 Mcf/d per well, 3.2 Bcf cumulative through month 104 (100% of its wells old enough at that month); the dashed curve runs through month 164, on our forecast where a well’s own record ends2018: 191 wells; starts at 1,125 Mcf/d per well, 3.3 Bcf cumulative through month 92 (100% of its wells old enough at that month); the dashed curve runs through month 152, on our forecast where a well’s own record ends2019: 155 wells; starts at 1,197 Mcf/d per well, 2.7 Bcf cumulative through month 80 (100% of its wells old enough at that month); the dashed curve runs through month 140, on our forecast where a well’s own record ends2020: 143 wells; starts at 1,090 Mcf/d per well, 2.7 Bcf cumulative through month 70 (100% of its wells old enough at that month); the dashed curve runs through month 130, on our forecast where a well’s own record ends2021: 147 wells; starts at 1,121 Mcf/d per well, 3.1 Bcf cumulative through month 56 (100% of its wells old enough at that month); the dashed curve runs through month 116, on our forecast where a well’s own record ends2022: 130 wells; starts at 972 Mcf/d per well, 2.2 Bcf cumulative through month 44 (100% of its wells old enough at that month); the dashed curve runs through month 104, on our forecast where a well’s own record ends2023: 171 wells; starts at 1,172 Mcf/d per well, 2.1 Bcf cumulative through month 32 (100% of its wells old enough at that month); the dashed curve runs through month 92, on our forecast where a well’s own record ends2024: 146 wells; starts at 1,029 Mcf/d per well, 1.7 Bcf cumulative through month 21 (100% of its wells old enough at that month); the dashed curve runs through month 81, on our forecast where a well’s own record ends2025: 173 wells; starts at 759 Mcf/d per well, 0.6 Bcf cumulative through month 8 (100% of its wells old enough at that month); the dashed curve runs through month 68, on our forecast where a well’s own record ends2026: 89 wells; starts at 662 Mcf/d per well, 0.0 Bcf cumulative through month 2 (100% of its wells old enough at that month); the dashed curve runs through month 62, on our forecast where a well’s own record ends1002005001,0002,0005,000Mcf/d24487296120144168192216Months on production
Arc Resources oil type curves (bbl/d per well, log scale, against months on production; cohorts 2010–2026)
Arc Resources oil type curves: average barrels per day per well on a log scale against months on production 2010-2014: 480 wells; starts at 51.8 bbl/d per well, 65.8 Mbbl cumulative through month 140 (100% of its wells old enough at that month); the dashed curve runs through month 200, on our forecast where a well’s own record ends2015: 188 wells; starts at 63.4 bbl/d per well, 140 Mbbl cumulative through month 128 (100% of its wells old enough at that month); the dashed curve runs through month 188, on our forecast where a well’s own record ends2016: 105 wells; starts at 141 bbl/d per well, 212 Mbbl cumulative through month 116 (100% of its wells old enough at that month); the dashed curve runs through month 176, on our forecast where a well’s own record ends2017: 180 wells; starts at 208 bbl/d per well, 174 Mbbl cumulative through month 104 (100% of its wells old enough at that month); the dashed curve runs through month 164, on our forecast where a well’s own record ends2018: 191 wells; starts at 211 bbl/d per well, 208 Mbbl cumulative through month 92 (100% of its wells old enough at that month); the dashed curve runs through month 152, on our forecast where a well’s own record ends2019: 155 wells; starts at 246 bbl/d per well, 180 Mbbl cumulative through month 80 (100% of its wells old enough at that month); the dashed curve runs through month 140, on our forecast where a well’s own record ends2020: 143 wells; starts at 115 bbl/d per well, 127 Mbbl cumulative through month 70 (100% of its wells old enough at that month); the dashed curve runs through month 130, on our forecast where a well’s own record ends2021: 147 wells; starts at 117 bbl/d per well, 129 Mbbl cumulative through month 56 (100% of its wells old enough at that month); the dashed curve runs through month 116, on our forecast where a well’s own record ends2022: 130 wells; starts at 101 bbl/d per well, 143 Mbbl cumulative through month 44 (100% of its wells old enough at that month); the dashed curve runs through month 104, on our forecast where a well’s own record ends2023: 171 wells; starts at 125 bbl/d per well, 90.3 Mbbl cumulative through month 32 (100% of its wells old enough at that month); the dashed curve runs through month 92, on our forecast where a well’s own record ends2024: 146 wells; starts at 90.8 bbl/d per well, 81.7 Mbbl cumulative through month 21 (100% of its wells old enough at that month); the dashed curve runs through month 81, on our forecast where a well’s own record ends2025: 173 wells; starts at 106 bbl/d per well, 56.1 Mbbl cumulative through month 8 (100% of its wells old enough at that month); the dashed curve runs through month 68, on our forecast where a well’s own record ends2026: 89 wells; starts at 74.9 bbl/d per well, 5.6 Mbbl cumulative through month 2 (100% of its wells old enough at that month); the dashed curve runs through month 62, on our forecast where a well’s own record ends25102050100200500700bbl/d24487296120144168192216Months on production

Horizontal wells only. Average production per well, for wells grouped by when they first produced.

How these curves are built

Horizontal wells only: 2,298 of the 2,342 wells in these cohorts. Average daily production per well, drawn against the cohort’s cumulative production per well on a log rate scale, for wells grouped by when they first produced. Includes every well of the cohort that is old enough at each month. Wells that are shut in or have stopped producing count as zero, so the average reflects the full cohort, not just survivors. Rates are calendar-day (volume ÷ days in month). The cumulative axis accumulates those same monthly averages at the average month length. Months not yet fully reported are excluded. The 2010-2014 curve draws those years as one group. The chart opens on average daily rate against months on production; the view control switches to rate against cumulative production per well (the log-rate form described above) or to cumulative production per well against months. Every view draws the same cohorts from the same production history. Each cohort is solid through the last month all of its wells sit inside fully reported data. Past it the dashed curve carries the same wells forward, on our forecast where a well’s own record ends, for up to five years. A dashed curve runs as far as at least nine in ten of its wells are accounted for. A well that is old enough but shut in still counts, as zero. The measured months are what these wells reported. In the forward months each well counts its own reported figure for each month it has one, our forecast for each month it has only that, and zero for the rest. The forward average counts every well of the cohort. The drawn forecast runs up to five years past the measured months. Line thickness tracks the size of each cohort.

Cohort summary table
First produced Wells Peak oil (bbl/d per well) Month-12 oil (bbl/d per well) Cum oil in series (Mbbl per well) Peak gas (Mcf/d per well) Month-12 gas (Mcf/d per well) Cum gas in series (Bcf per well) Months in series Wells old enough at last month in series Forecast months drawn
2026 89 111 5.6 662 0.0 2 100% 60
2025 173 343 56.1 3,033 0.6 8 100% 60
2024 146 299 99.9 81.7 4,112 2,562 1.7 21 100% 60
2023 171 286 85.8 90.3 4,480 2,552 2.1 32 100% 60
2022 130 430 129 143 4,033 2,175 2.2 44 100% 60
2021 147 314 105 129 4,320 2,734 3.1 56 100% 60
2020 143 268 97.4 127 3,972 2,113 2.7 70 100% 60
2019 155 435 122 180 3,142 2,064 2.7 80 100% 60
2018 191 526 148 208 3,901 2,407 3.3 92 100% 60
2017 180 361 112 174 3,730 2,068 3.2 104 100% 60
2016 105 439 148 212 3,236 2,274 3.2 116 100% 60
2015 188 223 99.8 140 2,467 1,992 2.9 128 100% 60
2010-2014 480 60.5 43.2 65.8 2,020 1,651 2.9 140 100% 60

Source: CommoVision (commovision.com)

Source: CommoVision · Arc Resources type curves, per-well production by first-production cohort.

Recent permitting

180 permits approved in the 365 days to August 11, 2026
18 permits in the 90 days to August 11, 2026
18 new-well permits in the 90 days to August 11, 2026
August 11, 2026 latest approval on record
About this chart

Approvals of every permit type per month, the 24 months to Aug 2026. The last bar is Aug 2026 through August 11, 2026 (2 so far), drawn hatched. All 180 approved in the 365 days to August 11, 2026 are permits to drill a new well. Permits to drill a new well: 180 in the 365 days to August 11, 2026 and 18 in the last 90 days of that window. How permits are counted.

  • Arc Resources was granted 180 well permits in the 365 days to August 11, 2026. Of those, 18 came in the last 90 days of that window. The latest approval on record is dated August 11, 2026.
  • All 180 approved in the 365 days to August 11, 2026 are permits to drill a new well. Permits to drill a new well: 180 in the 365 days to August 11, 2026 and 18 in the last 90 days of that window.
  • Permits counted here come from Alberta and British Columbia.
  • Manitoba reaches this page through production data alone.
Well permits approved per month: full table
MonthPermits approved
Aug 2026 (through August 11, 2026)2
Jul 20264
Jun 20260
May 202618
Apr 20261
Mar 202625
Feb 202613
Jan 20261
Dec 202515
Nov 202561
Oct 202531
Sep 20258
Aug 20251
Jul 20255
Jun 202527
May 20251
Apr 20255
Mar 202539
Feb 202519
Jan 202514
Dec 20240
Nov 20245
Oct 20241
Sep 202414

Source: CommoVision (commovision.com)

What we cover here

Each row names the grain a region’s production is held at. Where a source publishes at a coarser grain, the page says so.

DataGrainSinceBenchmark
Alberta production project + well 1962-01
British Columbia production well 1954-06
Manitoba production well 1951-02

Coverage rows for Arc Resources are regenerated at every build from the same catalog of sources the data is built from.

Top regions by 2025 operated production

RegionOil (MMbbl)Gas produced (Bcf)Share of 2025 output
Alberta25.424666.8%
British Columbia1.129533.2%

Share of output counts oil and gas together, gas at its market-value weight.

What the data shows

  • Arc Resources produced 26.5 MMbbl of oil and 541.0 Bcf of natural gas in 2025.
  • Arc Resources gas production peaked in 2023 at 541.6 Bcf; 2025 output of 541.0 Bcf ran at 100% of that peak.
  • Arc Resources operated production across 3 reporting regions in 1 country (Canada) in our coverage.
  • 2,405 operated producing wells tracked, trailing 12 months per region.

Get early access

Watch supply move as soon as its sources publish, with forecasts on 1.1+ million producing wells. The portal, an API and MCP access for AI tools open on October 1, 2026.

Data use is subject to our Terms of Service.