CommoVision

See the future in real time

Operator

ConocoPhillips Canada Resources

ConocoPhillips Canada Resources produced 54.4 MMbbl of oil and 64.5 Bcf of natural gas in 2025. 412 operated producing wells tracked, trailing 12 months per region.

  • Seventh-largest operator by operated oil in Alberta, 2025.
  • Operated 3.4% of the oil produced in Alberta, 2025.
  • Oil production rose 16% in 2025 from 2024.
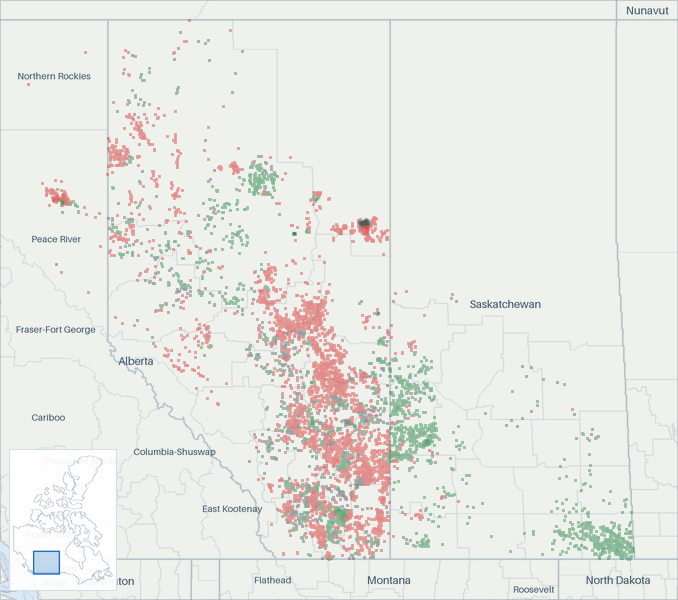
Well map of ConocoPhillips Canada Resources. The full map is further down this page.

Production

ConocoPhillips Canada Resources oil production (Mbbl/d, monthly average, grouped by when each well first produced)
ConocoPhillips Canada Resources oil production: thousand barrels per day, by first-production vintage today 50100150200 Mbbl/d 2017201820192020202120222023202420252026 Aug 2016: 91.2 Mbbl/d total Sep 2016: 95.8 Mbbl/d total Oct 2016: 100 Mbbl/d total Nov 2016: 104 Mbbl/d total Dec 2016: 113 Mbbl/d total Jan 2017: 113 Mbbl/d total Feb 2017: 118 Mbbl/d total Mar 2017: 98.9 Mbbl/d total Apr 2017: 73.3 Mbbl/d total May 2017: 129 Mbbl/d total Jun 2017: 127 Mbbl/d total Jul 2017: 119 Mbbl/d total Aug 2017: 141 Mbbl/d total Sep 2017: 136 Mbbl/d total Oct 2017: 138 Mbbl/d total Nov 2017: 140 Mbbl/d total Dec 2017: 142 Mbbl/d total Jan 2018: 140 Mbbl/d total Feb 2018: 141 Mbbl/d total Mar 2018: 135 Mbbl/d total Apr 2018: 129 Mbbl/d total May 2018: 135 Mbbl/d total Jun 2018: 138 Mbbl/d total Jul 2018: 129 Mbbl/d total Aug 2018: 136 Mbbl/d total Sep 2018: 152 Mbbl/d total Oct 2018: 140 Mbbl/d total Nov 2018: 148 Mbbl/d total Dec 2018: 151 Mbbl/d total Jan 2019: 125 Mbbl/d total Feb 2019: 129 Mbbl/d total Mar 2019: 138 Mbbl/d total Apr 2019: 135 Mbbl/d total May 2019: 57.4 Mbbl/d total Jun 2019: 131 Mbbl/d total Jul 2019: 133 Mbbl/d total Aug 2019: 134 Mbbl/d total Sep 2019: 129 Mbbl/d total Oct 2019: 134 Mbbl/d total Nov 2019: 136 Mbbl/d total Dec 2019: 136 Mbbl/d total Jan 2020: 135 Mbbl/d total Feb 2020: 135 Mbbl/d total Mar 2020: 134 Mbbl/d total Apr 2020: 104 Mbbl/d total May 2020: 43.2 Mbbl/d total Jun 2020: 58.4 Mbbl/d total Jul 2020: 72.6 Mbbl/d total Aug 2020: 86.8 Mbbl/d total Sep 2020: 142 Mbbl/d total Oct 2020: 141 Mbbl/d total Nov 2020: 144 Mbbl/d total Dec 2020: 143 Mbbl/d total Jan 2021: 147 Mbbl/d total Feb 2021: 150 Mbbl/d total Mar 2021: 142 Mbbl/d total Apr 2021: 145 Mbbl/d total May 2021: 142 Mbbl/d total Jun 2021: 148 Mbbl/d total Jul 2021: 140 Mbbl/d total Aug 2021: 148 Mbbl/d total Sep 2021: 151 Mbbl/d total Oct 2021: 149 Mbbl/d total Nov 2021: 149 Mbbl/d total Dec 2021: 134 Mbbl/d total Jan 2022: 129 Mbbl/d total Feb 2022: 134 Mbbl/d total Mar 2022: 133 Mbbl/d total Apr 2022: 131 Mbbl/d total May 2022: 131 Mbbl/d total Jun 2022: 97 Mbbl/d total Jul 2022: 134 Mbbl/d total Aug 2022: 135 Mbbl/d total Sep 2022: 141 Mbbl/d total Oct 2022: 140 Mbbl/d total Nov 2022: 137 Mbbl/d total Dec 2022: 136 Mbbl/d total Jan 2023: 137 Mbbl/d total Feb 2023: 136 Mbbl/d total Mar 2023: 135 Mbbl/d total Apr 2023: 128 Mbbl/d total May 2023: 128 Mbbl/d total Jun 2023: 127 Mbbl/d total Jul 2023: 122 Mbbl/d total Aug 2023: 127 Mbbl/d total Sep 2023: 125 Mbbl/d total Oct 2023: 127 Mbbl/d total Nov 2023: 130 Mbbl/d total Dec 2023: 130 Mbbl/d total Jan 2024: 129 Mbbl/d total Feb 2024: 136 Mbbl/d total Mar 2024: 141 Mbbl/d total Apr 2024: 136 Mbbl/d total May 2024: 147 Mbbl/d total Jun 2024: 143 Mbbl/d total Jul 2024: 142 Mbbl/d total Aug 2024: 59.7 Mbbl/d total Sep 2024: 77.1 Mbbl/d total Oct 2024: 143 Mbbl/d total Nov 2024: 136 Mbbl/d total Dec 2024: 147 Mbbl/d total Jan 2025: 147 Mbbl/d total Feb 2025: 146 Mbbl/d total Mar 2025: 146 Mbbl/d total Apr 2025: 150 Mbbl/d total May 2025: 147 Mbbl/d total Jun 2025: 141 Mbbl/d total Jul 2025: 152 Mbbl/d total Aug 2025: 154 Mbbl/d total Sep 2025: 146 Mbbl/d total Oct 2025: 149 Mbbl/d total Nov 2025: 156 Mbbl/d total Dec 2025: 155 Mbbl/d total Jan 2026: 153 Mbbl/d total Feb 2026: 160 Mbbl/d total Mar 2026: 161 Mbbl/d total Apr 2026: 154 Mbbl/d total May 2026: 143 Mbbl/d total Jun 2026: 139 Mbbl/d total Jul 2026: 136 Mbbl/d total

Still arriving: Aug 2026 <1% filed.

All from what the source published. All held at well grain.

How the volume breaks down
  • 100% Reported by the official source by well

Every barrel here starts from what the official source published for the months measured. Measured over January 1962 to July 2026.

ConocoPhillips Canada Resources natural gas production (MMcf/d, monthly average, grouped by when each well first produced)
ConocoPhillips Canada Resources natural gas production: million cubic feet per day, by first-production vintage today 100200300400 MMcf/d 2017201820192020202120222023202420252026 Aug 2016: 370 MMcf/d total Sep 2016: 354 MMcf/d total Oct 2016: 354 MMcf/d total Nov 2016: 345 MMcf/d total Dec 2016: 329 MMcf/d total Jan 2017: 329 MMcf/d total Feb 2017: 331 MMcf/d total Mar 2017: 330 MMcf/d total Apr 2017: 325 MMcf/d total May 2017: 343 MMcf/d total Jun 2017: 333 MMcf/d total Jul 2017: 347 MMcf/d total Aug 2017: 343 MMcf/d total Sep 2017: 47.6 MMcf/d total Oct 2017: 48.9 MMcf/d total Nov 2017: 48.5 MMcf/d total Dec 2017: 48.1 MMcf/d total Jan 2018: 27.1 MMcf/d total Feb 2018: 26.9 MMcf/d total Mar 2018: 25.8 MMcf/d total Apr 2018: 26.4 MMcf/d total May 2018: 25.3 MMcf/d total Jun 2018: 22.6 MMcf/d total Jul 2018: 24.2 MMcf/d total Aug 2018: 24.4 MMcf/d total Sep 2018: 27.3 MMcf/d total Oct 2018: 21.6 MMcf/d total Nov 2018: 19.5 MMcf/d total Dec 2018: 21.9 MMcf/d total Jan 2019: 14.8 MMcf/d total Feb 2019: 20.2 MMcf/d total Mar 2019: 16.6 MMcf/d total Apr 2019: 18.8 MMcf/d total May 2019: 13.8 MMcf/d total Jun 2019: 20.8 MMcf/d total Jul 2019: 21.3 MMcf/d total Aug 2019: 17.2 MMcf/d total Sep 2019: 22.3 MMcf/d total Oct 2019: 29.5 MMcf/d total Nov 2019: 22.8 MMcf/d total Dec 2019: 20.3 MMcf/d total Jan 2020: 18.3 MMcf/d total Feb 2020: 33 MMcf/d total Mar 2020: 56.4 MMcf/d total Apr 2020: 58.6 MMcf/d total May 2020: 57.1 MMcf/d total Jun 2020: 56.2 MMcf/d total Jul 2020: 49.3 MMcf/d total Aug 2020: 41.6 MMcf/d total Sep 2020: 72 MMcf/d total Oct 2020: 66.4 MMcf/d total Nov 2020: 85.9 MMcf/d total Dec 2020: 92.8 MMcf/d total Jan 2021: 115 MMcf/d total Feb 2021: 124 MMcf/d total Mar 2021: 129 MMcf/d total Apr 2021: 123 MMcf/d total May 2021: 111 MMcf/d total Jun 2021: 120 MMcf/d total Jul 2021: 106 MMcf/d total Aug 2021: 121 MMcf/d total Sep 2021: 103 MMcf/d total Oct 2021: 95.7 MMcf/d total Nov 2021: 118 MMcf/d total Dec 2021: 99.8 MMcf/d total Jan 2022: 97.2 MMcf/d total Feb 2022: 97.3 MMcf/d total Mar 2022: 92.3 MMcf/d total Apr 2022: 88.3 MMcf/d total May 2022: 86.6 MMcf/d total Jun 2022: 76.6 MMcf/d total Jul 2022: 87.6 MMcf/d total Aug 2022: 86.3 MMcf/d total Sep 2022: 56.5 MMcf/d total Oct 2022: 100 MMcf/d total Nov 2022: 106 MMcf/d total Dec 2022: 98.4 MMcf/d total Jan 2023: 95.4 MMcf/d total Feb 2023: 95.3 MMcf/d total Mar 2023: 97.8 MMcf/d total Apr 2023: 97.9 MMcf/d total May 2023: 65.6 MMcf/d total Jun 2023: 94.8 MMcf/d total Jul 2023: 75.5 MMcf/d total Aug 2023: 92.4 MMcf/d total Sep 2023: 101 MMcf/d total Oct 2023: 108 MMcf/d total Nov 2023: 135 MMcf/d total Dec 2023: 143 MMcf/d total Jan 2024: 141 MMcf/d total Feb 2024: 150 MMcf/d total Mar 2024: 163 MMcf/d total Apr 2024: 161 MMcf/d total May 2024: 170 MMcf/d total Jun 2024: 176 MMcf/d total Jul 2024: 170 MMcf/d total Aug 2024: 172 MMcf/d total Sep 2024: 175 MMcf/d total Oct 2024: 172 MMcf/d total Nov 2024: 163 MMcf/d total Dec 2024: 169 MMcf/d total Jan 2025: 171 MMcf/d total Feb 2025: 164 MMcf/d total Mar 2025: 159 MMcf/d total Apr 2025: 154 MMcf/d total May 2025: 190 MMcf/d total Jun 2025: 187 MMcf/d total Jul 2025: 185 MMcf/d total Aug 2025: 182 MMcf/d total Sep 2025: 184 MMcf/d total Oct 2025: 189 MMcf/d total Nov 2025: 189 MMcf/d total Dec 2025: 168 MMcf/d total Jan 2026: 183 MMcf/d total Feb 2026: 199 MMcf/d total Mar 2026: 192 MMcf/d total Apr 2026: 185 MMcf/d total May 2026: 185 MMcf/d total Jun 2026: 118 MMcf/d total Jul 2026: 227 MMcf/d total

Still arriving: Aug 2026 <1% filed.

All from what the source published. All held at well grain.

How the volume breaks down
  • 100% Reported by the official source by well

Every cubic foot here starts from what the official source published for the months measured. Measured over January 1962 to July 2026.

The bands group wells by when they first produced.

About this chart

The stack shows what is holding today's rate up and how much of it is new drilling. The bands draw the filings already in.

These volumes are the production from the wells and facilities this company operates. Ownership works differently: other parties hold interests in these wells, and this company holds interests in wells that other companies operate. How we attribute production to a company

Annual table (full history)
YearOil (MMbbl)Gas produced (Bcf)
202554.465
202446.861
202347.237
202248.033
202153.141
202040.821
201946.17
201850.99
201744.987
201627.2136
201512.8191
201412.8208
201312.7231
201211.7250
201110.8269
201010.5273
20098.4299
20088.5332
20075.6358
20067.5368
20058.2361
20048.9364
20038.8348
20027.0268
20017.9250
20008.0250
19998.0272
19988.2280
19978.3257
19968.1234
19957.6211
19948.1217
19937.0213
19926.0200
19915.8182
19906.3181
19896.4180
19887.0186
19877.5147
19868.3153
19859.6175
198410.5168
19839.4177
19829.1165
19819.4165
19808.8133
19799.8139
19786.2121
19776.1115
19766.1114
19757.1119
19746.9113
19737.596
19726.395
19714.8101
19704.593
19694.074
19683.951
19673.848
19663.243
19652.949
19642.956
19632.652
19622.643

Source: CommoVision (commovision.com)

Monthly table (last 24 months)
MonthOil (Mbbl)Gas produced (MMcf)
2026-074,202.27,051
2026-064,184.73,531
2026-054,433.25,747
2026-044,629.85,546
2026-034,998.95,951
2026-024,478.55,573
2026-014,730.75,670
2025-124,791.85,200
2025-114,690.95,658
2025-104,631.35,861
2025-094,371.95,513
2025-084,770.35,637
2025-074,717.05,725
2025-064,239.55,604
2025-054,553.25,880
2025-044,487.24,624
2025-034,532.84,929
2025-024,087.44,584
2025-014,556.45,315
2024-124,555.35,250
2024-114,094.34,898
2024-104,419.85,341
2024-092,313.15,251
2024-081,852.25,341

Source: CommoVision (commovision.com)

Source: CommoVision · ConocoPhillips Canada Resources, data through July 2026.

Well map

A map of 10,440 well locations operated by ConocoPhillips Canada Resources for which CommoVision holds a published surface coordinate, each drawn where it is and colored by its primary product (green for oil, red for natural gas, gray where undetermined; a spot shared by more than one product shows the one with the most wells there), on a ground of land and water over faint state, province, county and census-division outlines and place names for orientation, with a small inset map locating this frame in Canada.
  • Oil 2,487
  • Natural gas 5,415
  • Undetermined 2,538
10,440 well locations operated by ConocoPhillips Canada Resources, colored by primary product.
About this map

Undetermined means not enough signal to settle it. Producing wells are the ones that reported oil or gas in the trailing 12 months per region.

135.6 Mbbl/d Jul 2026 oil production -10.9% vs Jul last year
227.5 MMcf/d (est.) Jul 2026 gas production Jul 2026 is still filling in. The figure is the filings already in plus an estimate of the part not yet filed. The change compares this estimate with the same month last year. +23.2% vs Jul last year
149.1 Mbbl/d 2025 oil production
176.8 MMcf/d 2025 gas production
412 wells Operated producing wells tracked trailing 12 months per region
88.9 Mbbl/d Existing wells, Jul 2027 forecast Our forecast for existing wells.

Type curves

ConocoPhillips Canada Resources oil type curves (bbl/d per well, log scale, against months on production; cohorts 2010–2026)
ConocoPhillips Canada Resources oil type curves: average barrels per day per well on a log scale against months on production 2010-2014: 63 wells; starts at 121 bbl/d per well, 510 Mbbl cumulative through month 140 (100% of its wells old enough at that month); the dashed curve runs through month 200, on our forecast where a well’s own record ends2015: 90 wells; starts at 33.7 bbl/d per well, 2,382 Mbbl cumulative through month 128 (100% of its wells old enough at that month); the dashed curve runs through month 188, on our forecast where a well’s own record ends2016: 71 wells; starts at 39.2 bbl/d per well, 1,762 Mbbl cumulative through month 116 (100% of its wells old enough at that month); the dashed curve runs through month 176, on our forecast where a well’s own record ends2017: 13 wells; starts at 228 bbl/d per well, 376 Mbbl cumulative through month 105 (100% of its wells old enough at that month); the dashed curve runs through month 165, on our forecast where a well’s own record ends2018: 9 wells; starts at 152 bbl/d per well, 107 Mbbl cumulative through month 93 (100% of its wells old enough at that month); the dashed curve runs through month 153, on our forecast where a well’s own record ends2019: 28 wells; starts at 98.1 bbl/d per well, 269 Mbbl cumulative through month 80 (100% of its wells old enough at that month); the dashed curve runs through month 140, on our forecast where a well’s own record ends2020: 29 wells; starts at 4.3 bbl/d per well, 26.4 Mbbl cumulative through month 70 (100% of its wells old enough at that month); the dashed curve runs through month 130, on our forecast where a well’s own record ends2021: 21 wells; starts at 47.3 bbl/d per well, 519 Mbbl cumulative through month 56 (100% of its wells old enough at that month); the dashed curve runs through month 116, on our forecast where a well’s own record ends2022: 17 wells; starts at 90.2 bbl/d per well, 327 Mbbl cumulative through month 45 (100% of its wells old enough at that month); the dashed curve runs through month 105, on our forecast where a well’s own record ends2023: 28 wells; starts at 27.1 bbl/d per well, 401 Mbbl cumulative through month 32 (100% of its wells old enough at that month); the dashed curve runs through month 92, on our forecast where a well’s own record ends2024: 52 wells; starts at 174 bbl/d per well, 272 Mbbl cumulative through month 20 (100% of its wells old enough at that month); the dashed curve runs through month 80, on our forecast where a well’s own record ends2025: 39 wells; starts at 56.3 bbl/d per well, 68.5 Mbbl cumulative through month 8 (100% of its wells old enough at that month); the dashed curve runs through month 68, on our forecast where a well’s own record ends2026: 33 wells; starts at 19.7 bbl/d per well, 3.7 Mbbl cumulative through month 2 (48% of its wells old enough at that month)1101001,000bbl/d24487296120144168192216Months on production
ConocoPhillips Canada Resources natural gas type curves (Mcf/d per well, log scale, against months on production; cohorts 2010–2026)
ConocoPhillips Canada Resources natural gas type curves: average thousand cubic feet per day per well on a log scale against months on production 2010-2014: 63 wells; starts at 688 Mcf/d per well, 1.0 Bcf cumulative through month 140 (100% of its wells old enough at that month); the dashed curve runs through month 200, on our forecast where a well’s own record ends2015: 90 wells; starts at 23.8 Mcf/d per well, 0.3 Bcf cumulative through month 128 (100% of its wells old enough at that month); the dashed curve runs through month 188, on our forecast where a well’s own record ends2016: 71 wells; starts at 107 Mcf/d per well, 0.3 Bcf cumulative through month 116 (100% of its wells old enough at that month); the dashed curve runs through month 176, on our forecast where a well’s own record ends2017: 13 wells; starts at 462 Mcf/d per well, 1.6 Bcf cumulative through month 105 (100% of its wells old enough at that month); the dashed curve runs through month 165, on our forecast where a well’s own record ends2018: 9 wells; starts at 307 Mcf/d per well, 1.1 Bcf cumulative through month 93 (100% of its wells old enough at that month); the dashed curve runs through month 153, on our forecast where a well’s own record ends2019: 28 wells; starts at 182 Mcf/d per well, 1.3 Bcf cumulative through month 80 (100% of its wells old enough at that month); the dashed curve runs through month 140, on our forecast where a well’s own record ends2020: 29 wells; starts at 1,678 Mcf/d per well, 2.2 Bcf cumulative through month 70 (100% of its wells old enough at that month); the dashed curve runs through month 130, on our forecast where a well’s own record ends2021: 21 wells; starts at 1,332 Mcf/d per well, 1.4 Bcf cumulative through month 56 (100% of its wells old enough at that month); the dashed curve runs through month 116, on our forecast where a well’s own record ends2022: 17 wells; starts at 900 Mcf/d per well, 0.7 Bcf cumulative through month 45 (100% of its wells old enough at that month); the dashed curve runs through month 105, on our forecast where a well’s own record ends2023: 28 wells; starts at 1,270 Mcf/d per well, 1.2 Bcf cumulative through month 32 (100% of its wells old enough at that month); the dashed curve runs through month 92, on our forecast where a well’s own record ends2024: 52 wells; starts at 990 Mcf/d per well, 0.9 Bcf cumulative through month 20 (100% of its wells old enough at that month); the dashed curve runs through month 80, on our forecast where a well’s own record ends2025: 39 wells; starts at 617 Mcf/d per well, 0.3 Bcf cumulative through month 8 (100% of its wells old enough at that month); the dashed curve runs through month 68, on our forecast where a well’s own record ends2026: 33 wells; starts at 1,689 Mcf/d per well, 0.1 Bcf cumulative through month 2 (48% of its wells old enough at that month)3101001,0004,000Mcf/d24487296120144168192216Months on production

Horizontal wells only. Average production per well, for wells grouped by when they first produced.

How these curves are built

Horizontal wells only: 493 of the 507 wells in these cohorts. Average daily production per well, drawn against the cohort’s cumulative production per well on a log rate scale, for wells grouped by when they first produced. Includes every well of the cohort that is old enough at each month. Wells that are shut in or have stopped producing count as zero, so the average reflects the full cohort, not just survivors. Rates are calendar-day (volume ÷ days in month). The cumulative axis accumulates those same monthly averages at the average month length. Months not yet fully reported are excluded. The 2010-2014 curve draws those years as one group. The chart opens on average daily rate against months on production; the view control switches to rate against cumulative production per well (the log-rate form described above) or to cumulative production per well against months. Every view draws the same cohorts from the same production history. Each cohort with a dashed curve is solid through the last month all of its wells sit inside fully reported data. Past it the dashed curve carries the same wells forward, on our forecast where a well’s own record ends, for up to five years. A dashed curve runs as far as at least nine in ten of its wells are accounted for. A cohort with no dashed curve is drawn only through the months where at least 30% of its wells are old enough for the month to be fully reported. A well that is old enough but shut in still counts, as zero. The measured months are what these wells reported. In the forward months each well counts its own reported figure for each month it has one, our forecast for each month it has only that, and zero for the rest. The forward average counts every well of the cohort. The drawn forecast runs up to five years past the measured months. Line thickness tracks how many wells each curve is drawn from.

Cohort summary table
First produced Wells Peak oil (bbl/d per well) Month-12 oil (bbl/d per well) Cum oil in series (Mbbl per well) Peak gas (Mcf/d per well) Month-12 gas (Mcf/d per well) Cum gas in series (Bcf per well) Months in series Wells old enough at last month in series Forecast months drawn
2026 33 102 3.7 1,689 0.1 2 48%
2025 39 573 68.5 1,618 0.3 8 100% 60
2024 52 509 496 272 2,240 1,319 0.9 20 100% 60
2023 28 520 254 401 2,158 1,752 1.2 32 100% 60
2022 17 320 295 327 1,720 594 0.7 45 100% 60
2021 21 499 332 519 1,718 1,119 1.4 56 100% 60
2020 29 89.6 28.3 26.4 3,039 1,667 2.2 70 100% 60
2019 28 380 76.8 269 1,432 699 1.3 80 100% 60
2018 9 320 72.6 107 1,614 950 1.1 93 100% 60
2017 13 418 168 376 2,010 1,247 1.6 105 100% 60
2016 71 742 452 1,762 181 126 0.3 116 100% 60
2015 90 834 595 2,382 132 123 0.3 128 100% 60
2010-2014 63 175 129 510 1,583 698 1.0 140 100% 60

Source: CommoVision (commovision.com)

Source: CommoVision · ConocoPhillips Canada Resources type curves, per-well production by first-production cohort.

Recent permitting

61 permits approved in the 365 days to August 18, 2026
5 permits in the 90 days to August 18, 2026
5 new-well permits in the 90 days to August 18, 2026
August 18, 2026 latest approval on record
About this chart

Approvals of every permit type per month, the 24 months to Aug 2026. The last bar is Aug 2026 through August 18, 2026 (1 so far), drawn hatched. All 61 approved in the 365 days to August 18, 2026 are permits to drill a new well. Permits to drill a new well: 61 in the 365 days to August 18, 2026 and 5 in the last 90 days of that window. How permits are counted.

  • ConocoPhillips Canada Resources was granted 61 well permits in the 365 days to August 18, 2026. Of those, 5 came in the last 90 days of that window. The latest approval on record is dated August 18, 2026.
  • All 61 approved in the 365 days to August 18, 2026 are permits to drill a new well. Permits to drill a new well: 61 in the 365 days to August 18, 2026 and 5 in the last 90 days of that window.
Well permits approved per month: full table
MonthPermits approved
Aug 2026 (through August 18, 2026)1
Jul 20263
Jun 20261
May 20265
Apr 20264
Mar 202631
Feb 20263
Jan 20260
Dec 20256
Nov 20251
Oct 20255
Sep 20250
Aug 20253
Jul 20250
Jun 20250
May 202525
Apr 20250
Mar 20251
Feb 20251
Jan 20250
Dec 20240
Nov 202411
Oct 20240
Sep 20240

Source: CommoVision (commovision.com)

What we cover here

Each row names the grain a region’s production is held at. Where a source publishes at a coarser grain, the page says so.

DataGrainSinceBenchmark
Alberta production project + well 1962-01
British Columbia production well 1954-06

Coverage rows for ConocoPhillips Canada Resources are regenerated at every build from the same catalog of sources the data is built from.

Top regions by 2025 operated production

RegionOil (MMbbl)Gas produced (Bcf)Share of 2025 output
Alberta53.13.190.8%
British Columbia1.361.59.2%

Share of output counts oil and gas together, gas at its market-value weight.

What the data shows

  • ConocoPhillips Canada Resources produced 54.4 MMbbl of oil and 64.5 Bcf of natural gas in 2025.
  • ConocoPhillips Canada Resources oil production reached its highest level on record in 2025 at 54.4 MMbbl.
  • ConocoPhillips Canada Resources operated production across 2 reporting regions in 1 country (Canada) in our coverage.
  • 412 operated producing wells tracked, trailing 12 months per region.

Get early access

Watch supply move as soon as its sources publish, with forecasts on 1.1+ million producing wells. The portal, an API and MCP access for AI tools open on October 1, 2026.

Data use is subject to our Terms of Service.