CommoVision

See the future in real time

Operator

Pampa Energía S.A.

Pampa Energía S.A. produced 3.5 MMbbl of oil and 158.6 Bcf of natural gas in 2025. 217 operated producing wells tracked, trailing 12 months per region.

  • Fifth-largest operator by operated natural gas in Argentina, 2025.
  • Operated 8.7% of the natural gas produced in Argentina, 2025.
  • Natural gas production fell 3% in 2025 from 2024.
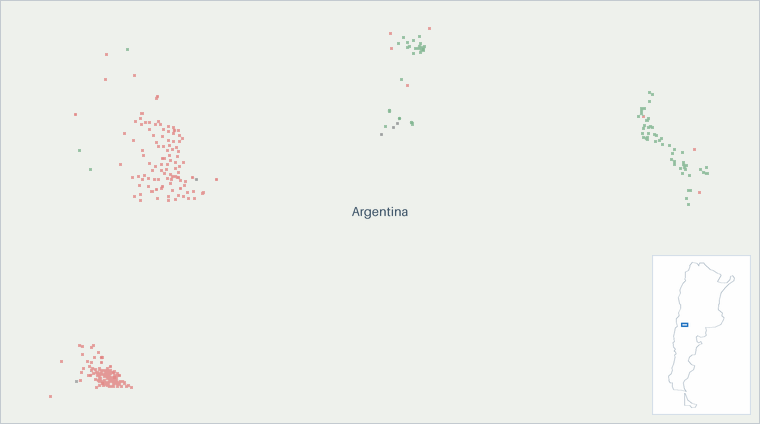
Well map of Pampa Energía S.A.. The full map is further down this page.

Production

Pampa Energía S.A. natural gas production (MMcf/d, monthly average, grouped by when each well first produced)
Pampa Energía S.A. natural gas production: million cubic feet per day, by first-production vintage today 200400600800 MMcf/d 2017201820192020202120222023202420252026 Aug 2016: 264 MMcf/d total Sep 2016: 266 MMcf/d total Oct 2016: 280 MMcf/d total Nov 2016: 145 MMcf/d total Dec 2016: 150 MMcf/d total Jan 2017: 150 MMcf/d total Feb 2017: 155 MMcf/d total Mar 2017: 158 MMcf/d total Apr 2017: 160 MMcf/d total May 2017: 160 MMcf/d total Jun 2017: 161 MMcf/d total Jul 2017: 162 MMcf/d total Aug 2017: 165 MMcf/d total Sep 2017: 166 MMcf/d total Oct 2017: 158 MMcf/d total Nov 2017: 166 MMcf/d total Dec 2017: 174 MMcf/d total Jan 2018: 175 MMcf/d total Feb 2018: 176 MMcf/d total Mar 2018: 169 MMcf/d total Apr 2018: 166 MMcf/d total May 2018: 159 MMcf/d total Jun 2018: 161 MMcf/d total Jul 2018: 160 MMcf/d total Aug 2018: 161 MMcf/d total Sep 2018: 156 MMcf/d total Oct 2018: 148 MMcf/d total Nov 2018: 149 MMcf/d total Dec 2018: 172 MMcf/d total Jan 2019: 189 MMcf/d total Feb 2019: 184 MMcf/d total Mar 2019: 203 MMcf/d total Apr 2019: 185 MMcf/d total May 2019: 200 MMcf/d total Jun 2019: 206 MMcf/d total Jul 2019: 208 MMcf/d total Aug 2019: 208 MMcf/d total Sep 2019: 219 MMcf/d total Oct 2019: 219 MMcf/d total Nov 2019: 215 MMcf/d total Dec 2019: 216 MMcf/d total Jan 2020: 214 MMcf/d total Feb 2020: 202 MMcf/d total Mar 2020: 210 MMcf/d total Apr 2020: 207 MMcf/d total May 2020: 213 MMcf/d total Jun 2020: 202 MMcf/d total Jul 2020: 226 MMcf/d total Aug 2020: 229 MMcf/d total Sep 2020: 229 MMcf/d total Oct 2020: 221 MMcf/d total Nov 2020: 204 MMcf/d total Dec 2020: 210 MMcf/d total Jan 2021: 209 MMcf/d total Feb 2021: 219 MMcf/d total Mar 2021: 218 MMcf/d total Apr 2021: 213 MMcf/d total May 2021: 230 MMcf/d total Jun 2021: 242 MMcf/d total Jul 2021: 268 MMcf/d total Aug 2021: 288 MMcf/d total Sep 2021: 297 MMcf/d total Oct 2021: 267 MMcf/d total Nov 2021: 274 MMcf/d total Dec 2021: 277 MMcf/d total Jan 2022: 287 MMcf/d total Feb 2022: 289 MMcf/d total Mar 2022: 286 MMcf/d total Apr 2022: 282 MMcf/d total May 2022: 339 MMcf/d total Jun 2022: 370 MMcf/d total Jul 2022: 368 MMcf/d total Aug 2022: 361 MMcf/d total Sep 2022: 318 MMcf/d total Oct 2022: 316 MMcf/d total Nov 2022: 299 MMcf/d total Dec 2022: 284 MMcf/d total Jan 2023: 305 MMcf/d total Feb 2023: 297 MMcf/d total Mar 2023: 304 MMcf/d total Apr 2023: 323 MMcf/d total May 2023: 373 MMcf/d total Jun 2023: 405 MMcf/d total Jul 2023: 376 MMcf/d total Aug 2023: 488 MMcf/d total Sep 2023: 491 MMcf/d total Oct 2023: 308 MMcf/d total Nov 2023: 329 MMcf/d total Dec 2023: 281 MMcf/d total Jan 2024: 358 MMcf/d total Feb 2024: 428 MMcf/d total Mar 2024: 440 MMcf/d total Apr 2024: 440 MMcf/d total May 2024: 548 MMcf/d total Jun 2024: 560 MMcf/d total Jul 2024: 551 MMcf/d total Aug 2024: 466 MMcf/d total Sep 2024: 443 MMcf/d total Oct 2024: 387 MMcf/d total Nov 2024: 391 MMcf/d total Dec 2024: 336 MMcf/d total Jan 2025: 389 MMcf/d total Feb 2025: 484 MMcf/d total Mar 2025: 388 MMcf/d total Apr 2025: 401 MMcf/d total May 2025: 439 MMcf/d total Jun 2025: 543 MMcf/d total Jul 2025: 596 MMcf/d total Aug 2025: 546 MMcf/d total Sep 2025: 363 MMcf/d total Oct 2025: 322 MMcf/d total Nov 2025: 320 MMcf/d total Dec 2025: 426 MMcf/d total Jan 2026: 422 MMcf/d total Feb 2026: 475 MMcf/d total Mar 2026: 503 MMcf/d total Apr 2026: 458 MMcf/d total May 2026: 517 MMcf/d total Jun 2026: 554 MMcf/d total Jul 2026: 517 MMcf/d total

Still arriving: Aug 2026 <1% filed.

All from what the source published. All held at well grain.

How the volume breaks down
  • 100% Reported by the official source by well

Every cubic foot here starts from what the official source published for the months measured. Measured over January 2016 to July 2026.

Pampa Energía S.A. oil production (Mbbl/d, monthly average, grouped by when each well first produced)
Pampa Energía S.A. oil production: thousand barrels per day, by first-production vintage today 102030 Mbbl/d 2017201820192020202120222023202420252026 Aug 2016: 12.1 Mbbl/d total Sep 2016: 12.5 Mbbl/d total Oct 2016: 12.7 Mbbl/d total Nov 2016: 7.07 Mbbl/d total Dec 2016: 6.72 Mbbl/d total Jan 2017: 6.73 Mbbl/d total Feb 2017: 6.71 Mbbl/d total Mar 2017: 7.27 Mbbl/d total Apr 2017: 7.45 Mbbl/d total May 2017: 7.27 Mbbl/d total Jun 2017: 7.39 Mbbl/d total Jul 2017: 7.32 Mbbl/d total Aug 2017: 7.41 Mbbl/d total Sep 2017: 7.23 Mbbl/d total Oct 2017: 7.21 Mbbl/d total Nov 2017: 7.11 Mbbl/d total Dec 2017: 6.86 Mbbl/d total Jan 2018: 6.87 Mbbl/d total Feb 2018: 6.67 Mbbl/d total Mar 2018: 6.67 Mbbl/d total Apr 2018: 0.16 Mbbl/d total May 2018: 0.15 Mbbl/d total Jun 2018: 0.1 Mbbl/d total Jul 2018: 0.12 Mbbl/d total Aug 2018: 0.12 Mbbl/d total Sep 2018: 0.11 Mbbl/d total Oct 2018: 0.1 Mbbl/d total Nov 2018: 0.08 Mbbl/d total Dec 2018: 0.07 Mbbl/d total Jan 2019: 0.07 Mbbl/d total Feb 2019: 0.06 Mbbl/d total Mar 2019: 0.09 Mbbl/d total Apr 2019: 0.08 Mbbl/d total May 2019: 0.1 Mbbl/d total Jun 2019: 0.09 Mbbl/d total Jul 2019: 0.11 Mbbl/d total Aug 2019: 0.12 Mbbl/d total Sep 2019: 0.18 Mbbl/d total Oct 2019: 0.13 Mbbl/d total Nov 2019: 0.12 Mbbl/d total Dec 2019: 0.76 Mbbl/d total Jan 2020: 0.78 Mbbl/d total Feb 2020: 0.55 Mbbl/d total Mar 2020: 0.47 Mbbl/d total Apr 2020: 0.09 Mbbl/d total May 2020: 0.06 Mbbl/d total Jun 2020: 0.07 Mbbl/d total Jul 2020: 0.08 Mbbl/d total Aug 2020: 0.09 Mbbl/d total Sep 2020: 0.07 Mbbl/d total Oct 2020: 0.07 Mbbl/d total Nov 2020: 0.06 Mbbl/d total Dec 2020: 0.05 Mbbl/d total Jan 2021: 0.05 Mbbl/d total Feb 2021: 0.05 Mbbl/d total Mar 2021: 0.05 Mbbl/d total Apr 2021: 0.05 Mbbl/d total May 2021: 0.08 Mbbl/d total Jun 2021: 0.05 Mbbl/d total Jul 2021: 0.07 Mbbl/d total Aug 2021: 0.09 Mbbl/d total Sep 2021: 0.08 Mbbl/d total Oct 2021: 0.09 Mbbl/d total Nov 2021: 0.1 Mbbl/d total Dec 2021: 0.08 Mbbl/d total Jan 2022: 0.06 Mbbl/d total Feb 2022: 0.08 Mbbl/d total Mar 2022: 0.08 Mbbl/d total Apr 2022: 0.04 Mbbl/d total May 2022: 0.06 Mbbl/d total Jun 2022: 0.07 Mbbl/d total Jul 2022: 0.07 Mbbl/d total Aug 2022: 0.1 Mbbl/d total Sep 2022: 0.08 Mbbl/d total Oct 2022: 0.08 Mbbl/d total Nov 2022: 0.08 Mbbl/d total Dec 2022: 0.11 Mbbl/d total Jan 2023: 0.06 Mbbl/d total Feb 2023: 0.09 Mbbl/d total Mar 2023: 0.09 Mbbl/d total Apr 2023: 0.1 Mbbl/d total May 2023: 0.09 Mbbl/d total Jun 2023: 0.1 Mbbl/d total Jul 2023: 0.1 Mbbl/d total Aug 2023: 0.07 Mbbl/d total Sep 2023: 0.1 Mbbl/d total Oct 2023: 0.06 Mbbl/d total Nov 2023: 0.08 Mbbl/d total Dec 2023: 0.98 Mbbl/d total Jan 2024: 0.92 Mbbl/d total Feb 2024: 0.98 Mbbl/d total Mar 2024: 1.34 Mbbl/d total Apr 2024: 1.72 Mbbl/d total May 2024: 1.59 Mbbl/d total Jun 2024: 1.53 Mbbl/d total Jul 2024: 1.68 Mbbl/d total Aug 2024: 1.54 Mbbl/d total Sep 2024: 1.4 Mbbl/d total Oct 2024: 1.32 Mbbl/d total Nov 2024: 1.2 Mbbl/d total Dec 2024: 1.12 Mbbl/d total Jan 2025: 1.04 Mbbl/d total Feb 2025: 0.95 Mbbl/d total Mar 2025: 1.07 Mbbl/d total Apr 2025: 1.29 Mbbl/d total May 2025: 6.41 Mbbl/d total Jun 2025: 8.9 Mbbl/d total Jul 2025: 12.4 Mbbl/d total Aug 2025: 15.5 Mbbl/d total Sep 2025: 16 Mbbl/d total Oct 2025: 15.8 Mbbl/d total Nov 2025: 17.1 Mbbl/d total Dec 2025: 18.6 Mbbl/d total Jan 2026: 18.1 Mbbl/d total Feb 2026: 16 Mbbl/d total Mar 2026: 21.1 Mbbl/d total Apr 2026: 20.6 Mbbl/d total May 2026: 25.8 Mbbl/d total Jun 2026: 20.8 Mbbl/d total Jul 2026: 16.6 Mbbl/d total

Still arriving: Aug 2026 <1% filed.

All from what the source published. All held at well grain.

How the volume breaks down
  • 100% Reported by the official source by well

Every barrel here starts from what the official source published for the months measured. Measured over January 2016 to July 2026.

The bands group wells by when they first produced.

About this chart

The stack shows what is holding today's rate up and how much of it is new drilling. The bands draw the filings already in.

These volumes are the production from the wells and facilities this company operates. Ownership works differently: other parties hold interests in these wells, and this company holds interests in wells that other companies operate. How we attribute production to a company

Annual table (full history)
YearOil (MMbbl)Gas produced (Bcf)
20253.5159
20240.5163
20230.1130
2022<0.1116
2021<0.191
20200.178
20190.175
20180.659
20172.659
20161.634

Source: CommoVision (commovision.com)

Monthly table (last 24 months)
MonthOil (Mbbl)Gas produced (MMcf)
2026-07515.516,033
2026-06623.116,628
2026-05799.216,036
2026-04617.013,754
2026-03652.915,599
2026-02446.913,293
2026-01560.013,076
2025-12577.513,220
2025-11512.19,599
2025-10490.69,997
2025-09480.410,892
2025-08481.716,916
2025-07382.818,461
2025-06267.016,281
2025-05198.613,595
2025-0438.612,030
2025-0333.312,021
2025-0226.513,547
2025-0132.212,045
2024-1234.810,414
2024-1136.011,722
2024-1041.111,993
2024-0941.913,283
2024-0847.814,432

Source: CommoVision (commovision.com)

Source: CommoVision · Pampa Energía S.A., data through July 2026.

Well map

A map of 350 well locations operated by Pampa Energía S.A. for which CommoVision holds a published surface coordinate, each drawn where it is and colored by its primary product (green for oil, red for natural gas, gray where undetermined; a spot shared by more than one product shows the one with the most wells there), on a ground of land and water over faint place names for orientation, with a small inset map locating this frame in Argentina.
  • Oil 93
  • Natural gas 246
  • Undetermined 11
350 well locations operated by Pampa Energía S.A., colored by primary product.
About this map

Undetermined means not enough signal to settle it. Producing wells are the ones that reported oil or gas in the trailing 12 months per region.

16.6 Mbbl/d Jul 2026 oil production +34.7% vs Jul last year
517.2 MMcf/d Jul 2026 gas production -13.2% vs Jul last year
9.6 Mbbl/d 2025 oil production
434.5 MMcf/d 2025 gas production
217 wells Operated producing wells tracked trailing 12 months per region

Type curves

Pampa Energía S.A. natural gas type curves (Mcf/d per well, log scale, against months on production; cohorts 2019–2026)
Pampa Energía S.A. natural gas type curves: average thousand cubic feet per day per well on a log scale against months on production 2019: 5 wells; starts at 1,174 Mcf/d per well, 5.0 Bcf cumulative through month 80 (100% of its wells old enough at that month); the dashed curve runs through month 140, on our forecast where a well’s own record ends2021: 3 wells; starts at 1,200 Mcf/d per well, 7.9 Bcf cumulative through month 56 (100% of its wells old enough at that month); the dashed curve runs through month 116, on our forecast where a well’s own record ends2023: 23 wells; starts at 3,752 Mcf/d per well, 7.0 Bcf cumulative through month 32 (100% of its wells old enough at that month); the dashed curve runs through month 92, on our forecast where a well’s own record ends2024: 10 wells; starts at 5,717 Mcf/d per well, 8.5 Bcf cumulative through month 24 (100% of its wells old enough at that month); the dashed curve runs through month 84, on our forecast where a well’s own record ends2025: 29 wells; starts at 779 Mcf/d per well, 0.8 Bcf cumulative through month 8 (100% of its wells old enough at that month); the dashed curve runs through month 68, on our forecast where a well’s own record ends2026: 24 wells; starts at 1,699 Mcf/d per well, 0.4 Bcf cumulative through month 3 (100% of its wells old enough at that month); the dashed curve runs through month 63, on our forecast where a well’s own record ends0.11101001,00010,00020,000Mcf/d24487296120144Months on production
Pampa Energía S.A. oil type curves (bbl/d per well, log scale, against months on production; cohorts 2019–2026)
Pampa Energía S.A. oil type curves: average barrels per day per well on a log scale against months on production 2019: 5 wells; starts at 133 bbl/d per well, 37.7 Mbbl cumulative through month 80 (100% of its wells old enough at that month); the dashed curve runs through month 140, on our forecast where a well’s own record ends2021: 3 wells; starts at 0.2 bbl/d per well, 1.8 Mbbl cumulative through month 56 (100% of its wells old enough at that month); the dashed curve runs through month 116, on our forecast where a well’s own record ends2023: 23 wells; starts at 1.1 bbl/d per well, 10.7 Mbbl cumulative through month 32 (100% of its wells old enough at that month); the dashed curve runs through month 92, on our forecast where a well’s own record ends2024: 10 wells; starts at 2.3 bbl/d per well, 49.4 Mbbl cumulative through month 23 (100% of its wells old enough at that month); the dashed curve runs through month 84, on our forecast where a well’s own record ends2025: 29 wells; starts at 242 bbl/d per well, 139 Mbbl cumulative through month 8 (100% of its wells old enough at that month); the dashed curve runs through month 68, on our forecast where a well’s own record ends2026: 24 wells; starts at 205 bbl/d per well, 55.9 Mbbl cumulative through month 3 (100% of its wells old enough at that month); the dashed curve runs through month 63, on our forecast where a well’s own record ends0.11101001,000bbl/d24487296120144Months on production

Horizontal wells only. Average production per well, for wells grouped by when they first produced.

How these curves are built

Horizontal wells only: 94 of the 111 wells in these cohorts. Average daily production per well, drawn against the cohort’s cumulative production per well on a log rate scale, for wells grouped by when they first produced. Includes every well of the cohort that is old enough at each month. Wells that are shut in or have stopped producing count as zero, so the average reflects the full cohort, not just survivors. Rates are calendar-day (volume ÷ days in month). The cumulative axis accumulates those same monthly averages at the average month length. Months not yet fully reported are excluded. The chart opens on average daily rate against months on production; the view control switches to rate against cumulative production per well (the log-rate form described above) or to cumulative production per well against months. Every view draws the same cohorts from the same production history. Each cohort is solid through the last month all of its wells sit inside fully reported data. Past it the dashed curve carries the same wells forward, on our forecast where a well’s own record ends, for up to five years. A dashed curve runs as far as at least nine in ten of its wells are accounted for. A well that is old enough but shut in still counts, as zero. The measured months are what these wells reported. In the forward months each well counts its own reported figure for each month it has one, our forecast for each month it has only that, and zero for the rest. The forward average counts every well of the cohort. The drawn forecast runs up to five years past the measured months. Line thickness tracks the size of each cohort.

Cohort summary table
First produced Wells Peak oil (bbl/d per well) Month-12 oil (bbl/d per well) Cum oil in series (Mbbl per well) Peak gas (Mcf/d per well) Month-12 gas (Mcf/d per well) Cum gas in series (Bcf per well) Months in series Wells old enough at last month in series Forecast months drawn
2026 24 865 55.9 5,593 0.4 3 100% 60
2025 29 899 139 4,730 0.8 8 100% 60
2024 10 122 59.5 49.4 17,482 13,622 8.5 24 100% 60
2023 23 42.1 9.7 10.7 12,430 6,724 7.0 32 100% 60
2021 3 3.6 0 1.8 15,474 8,779 7.9 56 100% 60
2019 5 139 0 37.7 7,181 3,572 5.0 80 100% 60

Source: CommoVision (commovision.com)

Source: CommoVision · Pampa Energía S.A. type curves, per-well production by first-production cohort.

What we cover here

Each row names the grain a region’s production is held at. Where a source publishes at a coarser grain, the page says so.

DataGrainSinceBenchmark
Argentina production well 2006-01

Coverage rows for Pampa Energía S.A. are regenerated at every build from the same catalog of sources the data is built from.

Top regions by 2025 operated production

RegionOil (MMbbl)Gas produced (Bcf)Share of 2025 output
Argentina3.5158.6100.0%

Share of output counts oil and gas together, gas at its market-value weight.

What the data shows

  • Pampa Energía S.A. produced 3.5 MMbbl of oil and 158.6 Bcf of natural gas in 2025.
  • Pampa Energía S.A. gas production peaked in 2024 at 163.0 Bcf; 2025 output of 158.6 Bcf ran at 97% of that peak.
  • Pampa Energía S.A. operated production across 1 reporting region in 1 country (Argentina) in our coverage.
  • 217 operated producing wells tracked, trailing 12 months per region.

Get early access

Watch supply move as soon as its sources publish, with forecasts on 1.1+ million producing wells. The portal, an API and MCP access for AI tools open on October 1, 2026.

Data use is subject to our Terms of Service.