CommoVision

See the future in real time

Ark-La-Tex

The Ark-La-Tex footprint produced 16.2 MMbbl of oil and 295.7 Bcf of natural gas in 2025. 15,339 producing wells tracked, trailing 12 months per region.

  • 0.6% of the natural gas produced in the United States, 2025.
  • Natural gas production fell 7% in 2025 from 2024.
Reported production data through June 2026 · well counts as of 2026-05

A supply area is the producing region we roll every well up to, and the level supply is traded at: how each area is drawn.

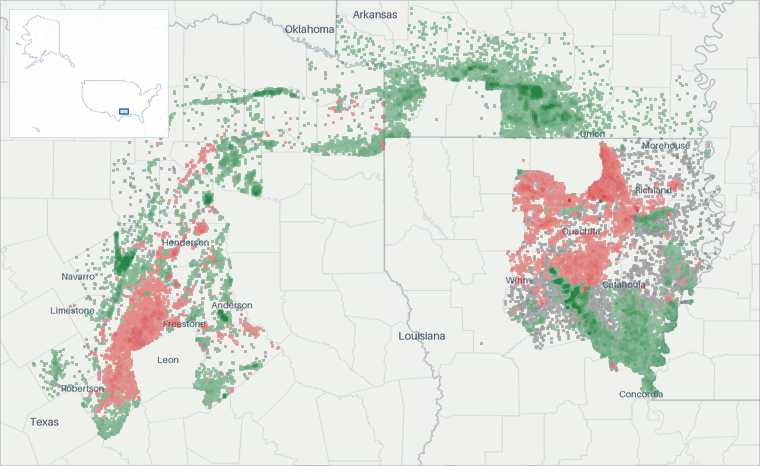
Well map of the Ark-La-Tex. The full map is further down this page.

Production

Ark-La-Tex natural gas production (MMcf/d, grouped by when each well first produced)
  • filling in (est. · missed) first filings ahead . This band is our estimate for the wells whose first filings are still ahead and that we cannot yet place in a start year. It is drawn past the divider only, as our forecast for those wells. . Hatching marks our estimate of the volume still to be filed. That estimate draws on our own production forecast. A check on the forecast behind this estimate measured a miss. It updates as filings arrive
  • estimated . Hatching marks our estimate. In the most recent months that is volume still to be filed. Past the divider it is our estimate of each whole month, built on any filings already in. Beyond the last filings it is our forecast.
Ark-La-Tex natural gas production: million cubic feet per day, by first-production vintage as filed so far today 5001,0001,5002,000 MMcf/d 2017201820192020202120222023202420252026 Jul 2016: 1,459 MMcf/d total Aug 2016: 1,676 MMcf/d total Sep 2016: 1,489 MMcf/d total Oct 2016: 1,471 MMcf/d total Nov 2016: 1,483 MMcf/d total Dec 2016: 1,427 MMcf/d total Jan 2017: 1,354 MMcf/d total Feb 2017: 1,404 MMcf/d total Mar 2017: 1,576 MMcf/d total Apr 2017: 1,494 MMcf/d total May 2017: 1,391 MMcf/d total Jun 2017: 1,417 MMcf/d total Jul 2017: 1,299 MMcf/d total Aug 2017: 1,378 MMcf/d total Sep 2017: 1,409 MMcf/d total Oct 2017: 1,373 MMcf/d total Nov 2017: 1,399 MMcf/d total Dec 2017: 1,535 MMcf/d total Jan 2018: 1,434 MMcf/d total Feb 2018: 1,369 MMcf/d total Mar 2018: 1,397 MMcf/d total Apr 2018: 1,298 MMcf/d total May 2018: 1,316 MMcf/d total Jun 2018: 1,359 MMcf/d total Jul 2018: 1,299 MMcf/d total Aug 2018: 1,321 MMcf/d total Sep 2018: 1,300 MMcf/d total Oct 2018: 1,281 MMcf/d total Nov 2018: 1,250 MMcf/d total Dec 2018: 1,226 MMcf/d total Jan 2019: 1,197 MMcf/d total Feb 2019: 1,188 MMcf/d total Mar 2019: 1,113 MMcf/d total Apr 2019: 1,156 MMcf/d total May 2019: 1,145 MMcf/d total Jun 2019: 1,143 MMcf/d total Jul 2019: 1,172 MMcf/d total Aug 2019: 1,148 MMcf/d total Sep 2019: 1,132 MMcf/d total Oct 2019: 1,083 MMcf/d total Nov 2019: 1,110 MMcf/d total Dec 2019: 1,103 MMcf/d total Jan 2020: 1,059 MMcf/d total Feb 2020: 1,044 MMcf/d total Mar 2020: 1,026 MMcf/d total Apr 2020: 981 MMcf/d total May 2020: 843 MMcf/d total Jun 2020: 947 MMcf/d total Jul 2020: 960 MMcf/d total Aug 2020: 967 MMcf/d total Sep 2020: 963 MMcf/d total Oct 2020: 899 MMcf/d total Nov 2020: 942 MMcf/d total Dec 2020: 961 MMcf/d total Jan 2021: 922 MMcf/d total Feb 2021: 795 MMcf/d total Mar 2021: 923 MMcf/d total Apr 2021: 935 MMcf/d total May 2021: 926 MMcf/d total Jun 2021: 909 MMcf/d total Jul 2021: 903 MMcf/d total Aug 2021: 895 MMcf/d total Sep 2021: 875 MMcf/d total Oct 2021: 865 MMcf/d total Nov 2021: 856 MMcf/d total Dec 2021: 842 MMcf/d total Jan 2022: 810 MMcf/d total Feb 2022: 813 MMcf/d total Mar 2022: 831 MMcf/d total Apr 2022: 857 MMcf/d total May 2022: 875 MMcf/d total Jun 2022: 860 MMcf/d total Jul 2022: 838 MMcf/d total Aug 2022: 846 MMcf/d total Sep 2022: 863 MMcf/d total Oct 2022: 842 MMcf/d total Nov 2022: 843 MMcf/d total Dec 2022: 822 MMcf/d total Jan 2023: 859 MMcf/d total Feb 2023: 810 MMcf/d total Mar 2023: 841 MMcf/d total Apr 2023: 786 MMcf/d total May 2023: 809 MMcf/d total Jun 2023: 800 MMcf/d total Jul 2023: 839 MMcf/d total Aug 2023: 920 MMcf/d total Sep 2023: 929 MMcf/d total Oct 2023: 907 MMcf/d total Nov 2023: 897 MMcf/d total Dec 2023: 848 MMcf/d total Jan 2024: 852 MMcf/d total Feb 2024: 874 MMcf/d total Mar 2024: 861 MMcf/d total Apr 2024: 866 MMcf/d total May 2024: 879 MMcf/d total Jun 2024: 908 MMcf/d total Jul 2024: 829 MMcf/d total Aug 2024: 890 MMcf/d total Sep 2024: 892 MMcf/d total Oct 2024: 868 MMcf/d total Nov 2024: 873 MMcf/d total Dec 2024: 868 MMcf/d total Jan 2025: 856 MMcf/d total Feb 2025: 795 MMcf/d total Mar 2025: 799 MMcf/d total Apr 2025: 811 MMcf/d total May 2025: 807 MMcf/d total Jun 2025: 793 MMcf/d total Jul 2025: 811 MMcf/d total Aug 2025: 827 MMcf/d total Sep 2025: 846 MMcf/d total Oct 2025: 811 MMcf/d total Nov 2025: 789 MMcf/d total Dec 2025: 778 MMcf/d total Jan 2026: 747 MMcf/d total Feb 2026: 749 MMcf/d total Mar 2026: 775 MMcf/d total Apr 2026: 780 MMcf/d total May 2026: 781 MMcf/d total Jun 2026: ≈779 MMcf/d total (100% arrived, remainder estimated)

Still arriving: Jul 2026 96% filed, Aug 2026 69% filed, Sep 2026 <1% filed.

In this view, hatching marks our estimate, and in the most recent months that is volume still to be filed. The band labeled first filings ahead is our estimate for the wells whose first filings are still ahead and that we cannot yet place in a start year; it is drawn past the divider only, as our forecast for those wells. The other bands continue past the divider as our estimate for the wells in them, from any filings already in and then from our forecast, built well by well. The method behind each well is recorded with the forecast. The forward months add no new wells. How our methods work

All from what the source published. All held at well grain.

How the volume breaks down
  • 80.5% Reported by the official source by well
  • 19.3% Reported by the official source as a lease total, split across the lease's wells. The regional total shown is the reported number, to rounding.
  • 0.19% A series adjusted to match figures the official source published: a well's cumulative, a later correction netted into the months before it, or a field's oil volume from the royalty file for a month missing from the production report.

Every cubic foot through May 2026 starts from what the official source published for those months. Measured over January 1993 to May 2026.

Ark-La-Tex oil production (Mbbl/d, grouped by when each well first produced)
  • filling in (est. · missed) first filings ahead . This band is our estimate for the wells whose first filings are still ahead and that we cannot yet place in a start year. It is drawn past the divider only, as our forecast for those wells. . Hatching marks our estimate of the volume still to be filed. That estimate draws on our own production forecast. A check on the forecast behind this estimate measured a miss. It updates as filings arrive
  • estimated . Hatching marks our estimate. In the most recent months that is volume still to be filed. Past the divider it is our estimate of each whole month, built on any filings already in. Beyond the last filings it is our forecast.
Ark-La-Tex oil production: thousand barrels per day, by first-production vintage as filed so far today 204060 Mbbl/d 2017201820192020202120222023202420252026 Jul 2016: 52.2 Mbbl/d total Aug 2016: 55.9 Mbbl/d total Sep 2016: 55 Mbbl/d total Oct 2016: 53.8 Mbbl/d total Nov 2016: 53.2 Mbbl/d total Dec 2016: 53.7 Mbbl/d total Jan 2017: 54.1 Mbbl/d total Feb 2017: 54.4 Mbbl/d total Mar 2017: 54 Mbbl/d total Apr 2017: 53.3 Mbbl/d total May 2017: 52.1 Mbbl/d total Jun 2017: 50.3 Mbbl/d total Jul 2017: 49.2 Mbbl/d total Aug 2017: 47.8 Mbbl/d total Sep 2017: 47.5 Mbbl/d total Oct 2017: 47.7 Mbbl/d total Nov 2017: 48.5 Mbbl/d total Dec 2017: 47.3 Mbbl/d total Jan 2018: 43.5 Mbbl/d total Feb 2018: 47.2 Mbbl/d total Mar 2018: 46.7 Mbbl/d total Apr 2018: 46.5 Mbbl/d total May 2018: 46.7 Mbbl/d total Jun 2018: 46.7 Mbbl/d total Jul 2018: 47 Mbbl/d total Aug 2018: 46.4 Mbbl/d total Sep 2018: 46.6 Mbbl/d total Oct 2018: 47 Mbbl/d total Nov 2018: 46.8 Mbbl/d total Dec 2018: 47.2 Mbbl/d total Jan 2019: 45.7 Mbbl/d total Feb 2019: 47.2 Mbbl/d total Mar 2019: 44.7 Mbbl/d total Apr 2019: 45.4 Mbbl/d total May 2019: 44.1 Mbbl/d total Jun 2019: 43.4 Mbbl/d total Jul 2019: 47 Mbbl/d total Aug 2019: 46.9 Mbbl/d total Sep 2019: 47.8 Mbbl/d total Oct 2019: 48.1 Mbbl/d total Nov 2019: 50 Mbbl/d total Dec 2019: 49.8 Mbbl/d total Jan 2020: 47.7 Mbbl/d total Feb 2020: 46.3 Mbbl/d total Mar 2020: 44.1 Mbbl/d total Apr 2020: 38.9 Mbbl/d total May 2020: 26.2 Mbbl/d total Jun 2020: 39.1 Mbbl/d total Jul 2020: 38.9 Mbbl/d total Aug 2020: 38.9 Mbbl/d total Sep 2020: 38.3 Mbbl/d total Oct 2020: 37.7 Mbbl/d total Nov 2020: 38.7 Mbbl/d total Dec 2020: 38.3 Mbbl/d total Jan 2021: 37.5 Mbbl/d total Feb 2021: 29.9 Mbbl/d total Mar 2021: 38.2 Mbbl/d total Apr 2021: 38.6 Mbbl/d total May 2021: 37.5 Mbbl/d total Jun 2021: 38 Mbbl/d total Jul 2021: 38.8 Mbbl/d total Aug 2021: 38.9 Mbbl/d total Sep 2021: 39.1 Mbbl/d total Oct 2021: 38.9 Mbbl/d total Nov 2021: 41.9 Mbbl/d total Dec 2021: 40.9 Mbbl/d total Jan 2022: 37.9 Mbbl/d total Feb 2022: 39.3 Mbbl/d total Mar 2022: 41.7 Mbbl/d total Apr 2022: 41.6 Mbbl/d total May 2022: 41 Mbbl/d total Jun 2022: 40.7 Mbbl/d total Jul 2022: 39.4 Mbbl/d total Aug 2022: 39.3 Mbbl/d total Sep 2022: 40.6 Mbbl/d total Oct 2022: 39.8 Mbbl/d total Nov 2022: 39.5 Mbbl/d total Dec 2022: 36.7 Mbbl/d total Jan 2023: 40.2 Mbbl/d total Feb 2023: 39.1 Mbbl/d total Mar 2023: 39.2 Mbbl/d total Apr 2023: 38.5 Mbbl/d total May 2023: 39 Mbbl/d total Jun 2023: 40.7 Mbbl/d total Jul 2023: 43.7 Mbbl/d total Aug 2023: 44 Mbbl/d total Sep 2023: 42.6 Mbbl/d total Oct 2023: 42.4 Mbbl/d total Nov 2023: 45.3 Mbbl/d total Dec 2023: 45.6 Mbbl/d total Jan 2024: 41.6 Mbbl/d total Feb 2024: 46.1 Mbbl/d total Mar 2024: 45.7 Mbbl/d total Apr 2024: 44.3 Mbbl/d total May 2024: 43.1 Mbbl/d total Jun 2024: 43.2 Mbbl/d total Jul 2024: 44.3 Mbbl/d total Aug 2024: 44.2 Mbbl/d total Sep 2024: 42.8 Mbbl/d total Oct 2024: 43.2 Mbbl/d total Nov 2024: 43 Mbbl/d total Dec 2024: 42.9 Mbbl/d total Jan 2025: 42.3 Mbbl/d total Feb 2025: 43.7 Mbbl/d total Mar 2025: 44.3 Mbbl/d total Apr 2025: 43.7 Mbbl/d total May 2025: 47.3 Mbbl/d total Jun 2025: 47.6 Mbbl/d total Jul 2025: 46.8 Mbbl/d total Aug 2025: 43.4 Mbbl/d total Sep 2025: 44.1 Mbbl/d total Oct 2025: 45 Mbbl/d total Nov 2025: 42.8 Mbbl/d total Dec 2025: 41.4 Mbbl/d total Jan 2026: 38.5 Mbbl/d total Feb 2026: 41.2 Mbbl/d total Mar 2026: 41.5 Mbbl/d total Apr 2026: 41.3 Mbbl/d total May 2026: 40.9 Mbbl/d total Jun 2026: ≈39.9 Mbbl/d total (100% arrived, remainder estimated)

Still arriving: Jul 2026 96% filed, Aug 2026 69% filed, Sep 2026 <1% filed.

In this view, hatching marks our estimate, and in the most recent months that is volume still to be filed. The band labeled first filings ahead is our estimate for the wells whose first filings are still ahead and that we cannot yet place in a start year; it is drawn past the divider only, as our forecast for those wells. The other bands continue past the divider as our estimate for the wells in them, from any filings already in and then from our forecast, built well by well. The method behind each well is recorded with the forecast. The forward months add no new wells. How our methods work

All from what the source published. All held at well grain.

How the volume breaks down
  • 43.8% Reported by the official source by well
  • 56.1% Reported by the official source as a lease total, split across the lease's wells. The regional total shown is the reported number, to rounding.
  • 0.03% A series adjusted to match figures the official source published: a well's cumulative, a later correction netted into the months before it, or a field's oil volume from the royalty file for a month missing from the production report.

Every barrel through May 2026 starts from what the official source published for those months. Measured over January 1993 to May 2026.

The bands group wells by when they first produced.

About this chart

The stack shows what is holding today's rate up and how much of it is new drilling. In the reported months the bands draw the filings already in. The months still filling in are marked.

In Texas, production is reported for an oil lease or unit as well as for individual gas wells. Those lease and unit totals are divided among the wells they cover, and every Texas barrel is labeled reported or allocated. How well-level Texas production is built

Annual table (full history)

best estimate incl. allocated

YearOil (MMbbl)Gas produced (Bcf)
202516.2296
202416.0319
202315.2312
202214.5307
202114.0324
202014.4353
201917.0416
201817.0482
201718.4518
201619.7564
201521.1572
201420.7547
201320.4557
201218.6575
201116.8682
201015.6774
200915.9869
200817.3893
200716.8790
200617.2746
200517.6731
200418.5645
200319.7578
200221.0483
200123.3438
200025.6356
199925.3296
199829.0315
199731.2338
199629.4330
199530.5315
199432.3324
199335.3329

Source: CommoVision (commovision.com)

Monthly table (last 24 months)
MonthOil (Mbbl)Gas produced (MMcf)
2026-051,267.324,196
2026-041,239.823,409
2026-031,286.224,026
2026-021,154.320,959
2026-011,193.923,149
2025-121,283.724,132
2025-111,283.223,668
2025-101,394.825,138
2025-091,323.825,372
2025-081,346.425,626
2025-071,450.825,143
2025-061,428.723,776
2025-051,465.425,012
2025-041,310.124,330
2025-031,373.824,755
2025-021,223.522,251
2025-011,311.026,532
2024-121,328.826,920
2024-111,289.526,176
2024-101,340.426,911
2024-091,284.426,768
2024-081,371.527,579
2024-071,371.825,710
2024-061,296.527,245

Source: CommoVision (commovision.com)

Source: CommoVision · Ark-La-Tex, data through June 2026.

Well map

A map of 89,799 well locations inside the Ark-La-Tex footprint for which CommoVision holds a published surface coordinate, each drawn where it is and colored by its primary product (green for oil, red for natural gas, gray where undetermined; a spot shared by more than one product shows the one with the most wells there), on a ground of land and water over faint state and county outlines and place names for orientation, with a small inset map locating this frame in the United States.
  • Oil 58,442
  • Natural gas 20,805
  • Undetermined 10,552
89,799 well locations inside the Ark-La-Tex footprint, colored by primary product. 168 more wells we track here sit outside this frame: their source publishes no coordinate, or their location falls beyond its edges.
About this map

Undetermined means not enough signal to settle it. Producing wells are the ones that reported oil or gas in the trailing 12 months per region.

Type curves

Ark-La-Tex natural gas type curves (Mcf/d per well, log scale, against months on production; cohorts 2010–2026)
Ark-La-Tex natural gas type curves: average thousand cubic feet per day per well on a log scale against months on production 2010-2014: 2,756 wells in curve; starts at 353 Mcf/d per well, 0.4 Bcf cumulative through month 138 (100% of its wells old enough at that month); the dashed curve runs through month 198, on our forecast where a well’s own record ends2015: 208 wells in curve; starts at 1,743 Mcf/d per well, 1.6 Bcf cumulative through month 127 (100% of its wells old enough at that month); the dashed curve runs through month 187, on our forecast where a well’s own record ends2016: 132 wells in curve; starts at 2,044 Mcf/d per well, 2.0 Bcf cumulative through month 115 (100% of its wells old enough at that month); the dashed curve runs through month 175, on our forecast where a well’s own record ends2017: 192 wells in curve; starts at 1,925 Mcf/d per well, 1.9 Bcf cumulative through month 103 (100% of its wells old enough at that month); the dashed curve runs through month 163, on our forecast where a well’s own record ends2018: 122 wells in curve; starts at 668 Mcf/d per well, 0.7 Bcf cumulative through month 90 (100% of its wells old enough at that month); the dashed curve runs through month 150, on our forecast where a well’s own record ends2019: 129 wells in curve; starts at 841 Mcf/d per well, 0.7 Bcf cumulative through month 79 (100% of its wells old enough at that month); the dashed curve runs through month 139, on our forecast where a well’s own record ends2020: 36 wells in curve; starts at 309 Mcf/d per well, 0.5 Bcf cumulative through month 68 (100% of its wells old enough at that month); the dashed curve runs through month 128, on our forecast where a well’s own record ends2021: 55 wells in curve; starts at 521 Mcf/d per well, 0.4 Bcf cumulative through month 55 (100% of its wells old enough at that month); the dashed curve runs through month 115, on our forecast where a well’s own record ends2022: 73 wells in curve; starts at 548 Mcf/d per well, 0.8 Bcf cumulative through month 43 (100% of its wells old enough at that month); the dashed curve runs through month 103, on our forecast where a well’s own record ends2023: 106 wells in curve; starts at 469 Mcf/d per well, 0.8 Bcf cumulative through month 31 (100% of its wells old enough at that month); the dashed curve runs through month 91, on our forecast where a well’s own record ends2024: 89 wells in curve; starts at 717 Mcf/d per well, 0.5 Bcf cumulative through month 19 (100% of its wells old enough at that month); the dashed curve runs through month 79, on our forecast where a well’s own record ends2025: 90 wells in curve; starts at 349 Mcf/d per well, 0.2 Bcf cumulative through month 6 (100% of its wells old enough at that month); the dashed curve runs through month 66, on our forecast where a well’s own record ends2026: 32 wells in curve; starts at 1,669 Mcf/d per well, 0.2 Bcf cumulative through month 2 (100% of its wells old enough at that month); the dashed curve runs through month 62, on our forecast where a well’s own record ends1520501002005001,0002,0005,000Mcf/d24487296120144168192216Months on production

2 of the drawn cohorts’ wells are not in these curves yet: each is still producing and joins its curve once it carries a forecast.

Ark-La-Tex oil type curves (bbl/d per well, log scale, against months on production; cohorts 2010–2026)
Ark-La-Tex oil type curves: average barrels per day per well on a log scale against months on production 2010-2014: 2,756 wells in curve; starts at 15.3 bbl/d per well, 21.0 Mbbl cumulative through month 138 (100% of its wells old enough at that month); the dashed curve runs through month 198, on our forecast where a well’s own record ends2015: 208 wells in curve; starts at 36.1 bbl/d per well, 43.9 Mbbl cumulative through month 127 (100% of its wells old enough at that month); the dashed curve runs through month 187, on our forecast where a well’s own record ends2016: 132 wells in curve; starts at 45.2 bbl/d per well, 45.4 Mbbl cumulative through month 115 (100% of its wells old enough at that month); the dashed curve runs through month 175, on our forecast where a well’s own record ends2017: 192 wells in curve; starts at 20.2 bbl/d per well, 18.7 Mbbl cumulative through month 103 (100% of its wells old enough at that month); the dashed curve runs through month 163, on our forecast where a well’s own record ends2018: 122 wells in curve; starts at 20.5 bbl/d per well, 28.0 Mbbl cumulative through month 90 (100% of its wells old enough at that month); the dashed curve runs through month 150, on our forecast where a well’s own record ends2019: 129 wells in curve; starts at 40.4 bbl/d per well, 51.0 Mbbl cumulative through month 79 (100% of its wells old enough at that month); the dashed curve runs through month 139, on our forecast where a well’s own record ends2020: 36 wells in curve; starts at 19.4 bbl/d per well, 17.4 Mbbl cumulative through month 68 (100% of its wells old enough at that month); the dashed curve runs through month 128, on our forecast where a well’s own record ends2021: 55 wells in curve; starts at 53.5 bbl/d per well, 65.7 Mbbl cumulative through month 55 (100% of its wells old enough at that month); the dashed curve runs through month 115, on our forecast where a well’s own record ends2022: 73 wells in curve; starts at 32.5 bbl/d per well, 40.0 Mbbl cumulative through month 43 (100% of its wells old enough at that month); the dashed curve runs through month 103, on our forecast where a well’s own record ends2023: 106 wells in curve; starts at 79.4 bbl/d per well, 49.0 Mbbl cumulative through month 31 (100% of its wells old enough at that month); the dashed curve runs through month 91, on our forecast where a well’s own record ends2024: 89 wells in curve; starts at 60.4 bbl/d per well, 34.5 Mbbl cumulative through month 19 (100% of its wells old enough at that month); the dashed curve runs through month 79, on our forecast where a well’s own record ends2025: 90 wells in curve; starts at 68.6 bbl/d per well, 18.6 Mbbl cumulative through month 6 (100% of its wells old enough at that month); the dashed curve runs through month 66, on our forecast where a well’s own record ends2026: 32 wells in curve; starts at 7 bbl/d per well, 0.7 Mbbl cumulative through month 2 (100% of its wells old enough at that month); the dashed curve runs through month 62, on our forecast where a well’s own record ends125102050100150bbl/d24487296120144168192216Months on production

2 of the drawn cohorts’ wells are not in these curves yet: each is still producing and joins its curve once it carries a forecast.

best estimate incl. allocated

Average production per well, for wells grouped by when they first produced.

How these curves are built

Average daily production per well, for wells grouped by when they first produced. Includes every well of the cohort that is old enough at each month, except wells that are still active but not yet covered by our forecasts; those are left out of both the reported and forecast parts until they are. Wells that are shut in or have stopped producing count as zero, so the average reflects the whole group drawn, not just survivors. Rates are calendar-day (volume ÷ days in month). The cumulative axis accumulates those same monthly averages at the average month length. Months not yet fully reported are excluded. The 2010-2014 curve draws those years as one group. The chart opens on average daily rate against months on production, the rate on a log scale. The view control switches to rate against cumulative production per well, on the same log rate scale, or to cumulative production per well against months on production, on a linear scale. Every view draws the same cohorts from the same production history. Each cohort is solid through the last month all the wells in its curve sit inside fully reported data. Past it the dashed curve carries the same wells forward, on our forecast where a well’s own record ends, for up to five years. A dashed curve runs as far as at least nine in ten of its wells are accounted for. A well that is old enough but shut in still counts, as zero. The measured months are what these wells reported. In the forward months each well counts its own reported figure for each month it has one, our forecast for each month it has only that, and zero for the rest. The forward average counts every well in the curve. The drawn forecast runs up to five years past the measured months. Line thickness tracks how many wells each curve is drawn from. 13,529 wells are counted here but not shown on the age axis: they started producing in 1995 or earlier, too close to the start of our records for their region to verify their true age.

Cohort summary table
First produced Wells in curve Peak oil (bbl/d per well) Month-12 oil (bbl/d per well) Cum oil in series (Mbbl per well) Peak gas (Mcf/d per well) Month-12 gas (Mcf/d per well) Cum gas in series (Bcf per well) Months in series Wells old enough at last month in series Forecast months drawn
2026 32 15.9 — 0.7 3,790 — 0.2 2 100% 60
2025 90 136 — 18.6 1,194 — 0.2 6 100% 60
2024 89 106 43 34.5 1,096 927 0.5 19 100% 60
2023 106 128 54.3 49.0 1,492 865 0.8 31 100% 60
2022 73 72.7 44.1 40.0 1,309 688 0.8 43 100% 60
2021 55 120 45.6 65.7 521 391 0.4 55 100% 60
2020 36 25.5 8.8 17.4 769 378 0.5 68 100% 60
2019 129 84.1 32 51.0 858 390 0.7 79 100% 60
2018 122 33.8 20 28.0 1,000 492 0.7 90 100% 60
2017 192 28.4 10.5 18.7 3,816 1,194 1.9 103 100% 60
2016 132 78.3 23.8 45.4 4,143 1,164 2.0 115 100% 60
2015 208 56 21.9 43.9 3,300 984 1.6 127 100% 60
2010-2014 2,756 21.4 10.5 21.0 605 258 0.4 138 100% 60

Source: CommoVision (commovision.com)

Source: CommoVision · Ark-La-Tex type curves, per-well production by first-production cohort.

Top operators in the Ark-La-Tex, 2025 best estimate incl. allocated

  1. MMGL East Texas II, LLC 13.5%
  2. Hilcorp Energy 10.1%
  3. Rose City Resources 8.3%
  4. Aethon Energy 8.0%
  5. Diversified Energy Company 7.1%
  6. Comstock Resources 6.5%
  7. Wildfire Energy Operating 6.1%
  8. TG Natural Resources 5.9%
  9. Nadel And Gussman Ruston, LLC 2.5%
  10. ExxonMobil 2.4%
  11. 406 other operators 29.1%
  12. Without a named operator 0.4%
Top operators in the Ark-La-Tex, 2025: full table
OperatorOil (Mbbl/d, 2025)Gas produced (MMcf/d, 2025)Share of output
MMGL East Texas II, LLC 6.0109.413.5%
Hilcorp Energy 0.1148.010.1%
Rose City Resources 8.02.68.3%
Aethon Energy 0.0118.88.0%
Diversified Energy Company 0.1103.97.1%
Comstock Resources 0.095.56.5%
Wildfire Energy Operating 5.83.86.1%
TG Natural Resources 0.480.45.9%
Nadel And Gussman Ruston, LLC 0.234.12.5%
ExxonMobil 2.22.32.4%
406 other operators 21.2111.429.1%
Without a named operator 0.30.10.4%

Mbbl/d = thousand barrels per day · MMcf/d = million cubic feet per day (units).

Source: CommoVision (commovision.com)

Top counties by 2025 production best estimate incl. allocated

CountyOil (MMbbl)Gas produced (Bcf)Share of 2025 output
Robertson County, Texas2.697.728.8%
Wood County, Texas3.14415.9%
Freestone County, Texas061.115.6%
Lincoln Parish, Louisiana0.246.412.2%
Cass County, Texas2.925.0%

Share of output counts oil and gas together, gas at its market-value weight.

Recent permitting

225 permits approved in the 365 days to October 13, 2026
65 permits in the 90 days to October 13, 2026
41 new-well permits in the 90 days to October 13, 2026
October 13, 2026 latest approval on record
About this chart

Approvals of every permit type per month, the 24 months to Oct 2026. The last bar is Oct 2026 through October 13, 2026 (5 so far), drawn hatched. Of the 225 approved in the 365 days to October 13, 2026, 150 are permits to drill a new well, 64 are recompletion permits, 7 are other permit types and 4 are permits to deepen, sidetrack or re-enter existing wells. Permits to drill a new well: 150 in the 365 days to October 13, 2026 and 41 in the last 90 days of that window. How permits are counted.

Most permits 365 days to October 13, 2026

  1. Hilcorp Energy 35 · 15.6%
  2. Rose City Resources 18 · 8.0%
  3. Northland Operating Company 17 · 7.6%
  4. ExxonMobil 13 · 5.8%
  5. BASA Resources 9 · 4.0%
  • In the Ark-La-Tex footprint, 225 well permits were approved in the 365 days to October 13, 2026. Of those, 65 came in the last 90 days of that window. The latest approval on record is dated October 13, 2026.
  • Of the 225 approved in the 365 days to October 13, 2026, 150 are permits to drill a new well, 64 are recompletion permits, 7 are other permit types and 4 are permits to deepen, sidetrack or re-enter existing wells. Permits to drill a new well: 150 in the 365 days to October 13, 2026 and 41 in the last 90 days of that window.
  • Permits counted here come from Arkansas, Louisiana and Texas.
  • Mississippi reaches this page through production data alone.
Well permits approved per month: full table
MonthPermits approved
Oct 2026 (through October 13, 2026)5
Sep 202614
Aug 202627
Jul 202628
Jun 202632
May 202616
Apr 202620
Mar 202626
Feb 202612
Jan 20264
Dec 202519
Nov 202514
Oct 202517
Sep 202531
Aug 202517
Jul 202526
Jun 202517
May 202513
Apr 20259
Mar 202517
Feb 202511
Jan 202522
Dec 202412
Nov 202418

Source: CommoVision (commovision.com)

Active drilling rigs

6 rigs active in the week to October 16, 2026
+3 rigs vs the same week a year earlier
15 rigs peak week, Aug 2017 (since Oct 2016)
Active drilling rigs by rig type (rigs, weekly count)Source: Baker Hughes
Oil Gas Miscellaneous
Active drilling rigs by rig type: rigs, weekly count 5 10 15 20 rigs 2017201820192020202120222023202420252026 Week to Oct 21, 2016: 11 rigs total (Oil 4, Gas 7, Miscellaneous 0) Week to Oct 28, 2016: 11 rigs total (Oil 3, Gas 8, Miscellaneous 0) Week to Nov 4, 2016: 13 rigs total (Oil 3, Gas 10, Miscellaneous 0) Week to Nov 11, 2016: 13 rigs total (Oil 3, Gas 10, Miscellaneous 0) Week to Nov 18, 2016: 11 rigs total (Oil 3, Gas 8, Miscellaneous 0) Week to Nov 23, 2016: 11 rigs total (Oil 3, Gas 8, Miscellaneous 0) Week to Dec 2, 2016: 10 rigs total (Oil 2, Gas 8, Miscellaneous 0) Week to Dec 9, 2016: 12 rigs total (Oil 4, Gas 8, Miscellaneous 0) Week to Dec 16, 2016: 12 rigs total (Oil 4, Gas 8, Miscellaneous 0) Week to Dec 23, 2016: 11 rigs total (Oil 3, Gas 8, Miscellaneous 0) Week to Dec 30, 2016: 11 rigs total (Oil 3, Gas 8, Miscellaneous 0) Week to Jan 6, 2017: 9 rigs total (Oil 1, Gas 8, Miscellaneous 0) Week to Jan 13, 2017: 9 rigs total (Oil 1, Gas 8, Miscellaneous 0) Week to Jan 20, 2017: 10 rigs total (Oil 2, Gas 8, Miscellaneous 0) Week to Jan 27, 2017: 11 rigs total (Oil 2, Gas 9, Miscellaneous 0) Week to Feb 3, 2017: 11 rigs total (Oil 1, Gas 10, Miscellaneous 0) Week to Feb 10, 2017: 11 rigs total (Oil 1, Gas 10, Miscellaneous 0) Week to Feb 17, 2017: 10 rigs total (Oil 0, Gas 10, Miscellaneous 0) Week to Feb 24, 2017: 11 rigs total (Oil 1, Gas 10, Miscellaneous 0) Week to Mar 3, 2017: 12 rigs total (Oil 1, Gas 11, Miscellaneous 0) Week to Mar 10, 2017: 12 rigs total (Oil 1, Gas 11, Miscellaneous 0) Week to Mar 17, 2017: 11 rigs total (Oil 1, Gas 10, Miscellaneous 0) Week to Mar 24, 2017: 9 rigs total (Oil 1, Gas 8, Miscellaneous 0) Week to Mar 31, 2017: 10 rigs total (Oil 3, Gas 7, Miscellaneous 0) Week to Apr 7, 2017: 10 rigs total (Oil 3, Gas 7, Miscellaneous 0) Week to Apr 13, 2017: 10 rigs total (Oil 3, Gas 7, Miscellaneous 0) Week to Apr 21, 2017: 10 rigs total (Oil 2, Gas 8, Miscellaneous 0) Week to Apr 28, 2017: 10 rigs total (Oil 2, Gas 8, Miscellaneous 0) Week to May 5, 2017: 10 rigs total (Oil 2, Gas 8, Miscellaneous 0) Week to May 12, 2017: 10 rigs total (Oil 2, Gas 8, Miscellaneous 0) Week to May 19, 2017: 10 rigs total (Oil 1, Gas 9, Miscellaneous 0) Week to May 26, 2017: 10 rigs total (Oil 1, Gas 9, Miscellaneous 0) Week to Jun 2, 2017: 11 rigs total (Oil 1, Gas 10, Miscellaneous 0) Week to Jun 9, 2017: 11 rigs total (Oil 1, Gas 10, Miscellaneous 0) Week to Jun 16, 2017: 12 rigs total (Oil 2, Gas 10, Miscellaneous 0) Week to Jun 23, 2017: 12 rigs total (Oil 2, Gas 10, Miscellaneous 0) Week to Jun 30, 2017: 12 rigs total (Oil 2, Gas 10, Miscellaneous 0) Week to Jul 7, 2017: 13 rigs total (Oil 3, Gas 10, Miscellaneous 0) Week to Jul 14, 2017: 13 rigs total (Oil 3, Gas 10, Miscellaneous 0) Week to Jul 21, 2017: 14 rigs total (Oil 4, Gas 10, Miscellaneous 0) Week to Jul 28, 2017: 14 rigs total (Oil 4, Gas 10, Miscellaneous 0) Week to Aug 4, 2017: 14 rigs total (Oil 4, Gas 10, Miscellaneous 0) Week to Aug 11, 2017: 14 rigs total (Oil 4, Gas 10, Miscellaneous 0) Week to Aug 18, 2017: 14 rigs total (Oil 4, Gas 10, Miscellaneous 0) Week to Aug 25, 2017: 14 rigs total (Oil 4, Gas 10, Miscellaneous 0) Week to Sep 1, 2017: 15 rigs total (Oil 4, Gas 11, Miscellaneous 0) Week to Sep 8, 2017: 13 rigs total (Oil 3, Gas 10, Miscellaneous 0) Week to Sep 15, 2017: 12 rigs total (Oil 2, Gas 10, Miscellaneous 0) Week to Sep 22, 2017: 12 rigs total (Oil 2, Gas 10, Miscellaneous 0) Week to Sep 29, 2017: 12 rigs total (Oil 2, Gas 10, Miscellaneous 0) Week to Oct 6, 2017: 12 rigs total (Oil 2, Gas 10, Miscellaneous 0) Week to Oct 13, 2017: 12 rigs total (Oil 2, Gas 10, Miscellaneous 0) Week to Oct 20, 2017: 13 rigs total (Oil 2, Gas 11, Miscellaneous 0) Week to Oct 27, 2017: 12 rigs total (Oil 2, Gas 10, Miscellaneous 0) Week to Nov 3, 2017: 12 rigs total (Oil 2, Gas 10, Miscellaneous 0) Week to Nov 10, 2017: 12 rigs total (Oil 2, Gas 10, Miscellaneous 0) Week to Nov 17, 2017: 11 rigs total (Oil 2, Gas 9, Miscellaneous 0) Week to Nov 22, 2017: 11 rigs total (Oil 2, Gas 9, Miscellaneous 0) Week to Dec 1, 2017: 11 rigs total (Oil 2, Gas 9, Miscellaneous 0) Week to Dec 8, 2017: 8 rigs total (Oil 2, Gas 6, Miscellaneous 0) Week to Dec 15, 2017: 8 rigs total (Oil 2, Gas 6, Miscellaneous 0) Week to Dec 22, 2017: 8 rigs total (Oil 2, Gas 6, Miscellaneous 0) Week to Dec 29, 2017: 8 rigs total (Oil 2, Gas 6, Miscellaneous 0) Week to Jan 5, 2018: 8 rigs total (Oil 2, Gas 6, Miscellaneous 0) Week to Jan 12, 2018: 8 rigs total (Oil 2, Gas 6, Miscellaneous 0) Week to Jan 19, 2018: 7 rigs total (Oil 2, Gas 5, Miscellaneous 0) Week to Jan 26, 2018: 7 rigs total (Oil 2, Gas 5, Miscellaneous 0) Week to Feb 2, 2018: 5 rigs total (Oil 2, Gas 3, Miscellaneous 0) Week to Feb 9, 2018: 4 rigs total (Oil 0, Gas 4, Miscellaneous 0) Week to Feb 16, 2018: 4 rigs total (Oil 0, Gas 4, Miscellaneous 0) Week to Feb 23, 2018: 4 rigs total (Oil 0, Gas 4, Miscellaneous 0) Week to Mar 2, 2018: 4 rigs total (Oil 0, Gas 4, Miscellaneous 0) Week to Mar 9, 2018: 4 rigs total (Oil 0, Gas 4, Miscellaneous 0) Week to Mar 16, 2018: 4 rigs total (Oil 0, Gas 4, Miscellaneous 0) Week to Mar 23, 2018: 4 rigs total (Oil 1, Gas 3, Miscellaneous 0) Week to Mar 29, 2018: 4 rigs total (Oil 1, Gas 3, Miscellaneous 0) Week to Apr 6, 2018: 4 rigs total (Oil 1, Gas 3, Miscellaneous 0) Week to Apr 13, 2018: 5 rigs total (Oil 2, Gas 3, Miscellaneous 0) Week to Apr 20, 2018: 5 rigs total (Oil 2, Gas 3, Miscellaneous 0) Week to Apr 27, 2018: 5 rigs total (Oil 3, Gas 2, Miscellaneous 0) Week to May 4, 2018: 5 rigs total (Oil 3, Gas 2, Miscellaneous 0) Week to May 11, 2018: 5 rigs total (Oil 3, Gas 2, Miscellaneous 0) Week to May 18, 2018: 6 rigs total (Oil 3, Gas 3, Miscellaneous 0) Week to May 25, 2018: 6 rigs total (Oil 3, Gas 3, Miscellaneous 0) Week to Jun 1, 2018: 6 rigs total (Oil 3, Gas 3, Miscellaneous 0) Week to Jun 8, 2018: 6 rigs total (Oil 3, Gas 3, Miscellaneous 0) Week to Jun 15, 2018: 6 rigs total (Oil 3, Gas 3, Miscellaneous 0) Week to Jun 22, 2018: 6 rigs total (Oil 3, Gas 3, Miscellaneous 0) Week to Jun 29, 2018: 6 rigs total (Oil 3, Gas 3, Miscellaneous 0) Week to Jul 6, 2018: 6 rigs total (Oil 3, Gas 3, Miscellaneous 0) Week to Jul 13, 2018: 6 rigs total (Oil 3, Gas 3, Miscellaneous 0) Week to Jul 20, 2018: 6 rigs total (Oil 3, Gas 3, Miscellaneous 0) Week to Jul 27, 2018: 4 rigs total (Oil 3, Gas 1, Miscellaneous 0) Week to Aug 3, 2018: 4 rigs total (Oil 3, Gas 1, Miscellaneous 0) Week to Aug 10, 2018: 3 rigs total (Oil 1, Gas 2, Miscellaneous 0) Week to Aug 17, 2018: 3 rigs total (Oil 1, Gas 2, Miscellaneous 0) Week to Aug 24, 2018: 4 rigs total (Oil 1, Gas 3, Miscellaneous 0) Week to Aug 31, 2018: 4 rigs total (Oil 1, Gas 3, Miscellaneous 0) Week to Sep 7, 2018: 4 rigs total (Oil 1, Gas 3, Miscellaneous 0) Week to Sep 14, 2018: 4 rigs total (Oil 1, Gas 3, Miscellaneous 0) Week to Sep 21, 2018: 4 rigs total (Oil 1, Gas 3, Miscellaneous 0) Week to Sep 28, 2018: 3 rigs total (Oil 1, Gas 2, Miscellaneous 0) Week to Oct 5, 2018: 3 rigs total (Oil 1, Gas 2, Miscellaneous 0) Week to Oct 12, 2018: 7 rigs total (Oil 3, Gas 4, Miscellaneous 0) Week to Oct 19, 2018: 7 rigs total (Oil 3, Gas 4, Miscellaneous 0) Week to Oct 26, 2018: 7 rigs total (Oil 3, Gas 4, Miscellaneous 0) Week to Nov 2, 2018: 7 rigs total (Oil 3, Gas 4, Miscellaneous 0) Week to Nov 9, 2018: 5 rigs total (Oil 2, Gas 3, Miscellaneous 0) Week to Nov 16, 2018: 5 rigs total (Oil 2, Gas 3, Miscellaneous 0) Week to Nov 21, 2018: 5 rigs total (Oil 2, Gas 3, Miscellaneous 0) Week to Nov 30, 2018: 5 rigs total (Oil 2, Gas 3, Miscellaneous 0) Week to Dec 7, 2018: 6 rigs total (Oil 0, Gas 6, Miscellaneous 0) Week to Dec 14, 2018: 7 rigs total (Oil 0, Gas 7, Miscellaneous 0) Week to Dec 21, 2018: 7 rigs total (Oil 0, Gas 7, Miscellaneous 0) Week to Dec 28, 2018: 8 rigs total (Oil 1, Gas 7, Miscellaneous 0) Week to Jan 4, 2019: 8 rigs total (Oil 1, Gas 7, Miscellaneous 0) Week to Jan 11, 2019: 8 rigs total (Oil 1, Gas 7, Miscellaneous 0) Week to Jan 18, 2019: 6 rigs total (Oil 0, Gas 6, Miscellaneous 0) Week to Jan 25, 2019: 6 rigs total (Oil 0, Gas 6, Miscellaneous 0) Week to Feb 1, 2019: 7 rigs total (Oil 0, Gas 7, Miscellaneous 0) Week to Feb 8, 2019: 6 rigs total (Oil 0, Gas 6, Miscellaneous 0) Week to Feb 15, 2019: 6 rigs total (Oil 0, Gas 6, Miscellaneous 0) Week to Feb 22, 2019: 6 rigs total (Oil 0, Gas 6, Miscellaneous 0) Week to Mar 1, 2019: 6 rigs total (Oil 0, Gas 6, Miscellaneous 0) Week to Mar 8, 2019: 6 rigs total (Oil 0, Gas 6, Miscellaneous 0) Week to Mar 15, 2019: 4 rigs total (Oil 0, Gas 4, Miscellaneous 0) Week to Mar 22, 2019: 4 rigs total (Oil 0, Gas 4, Miscellaneous 0) Week to Mar 29, 2019: 4 rigs total (Oil 0, Gas 4, Miscellaneous 0) Week to Apr 5, 2019: 3 rigs total (Oil 0, Gas 3, Miscellaneous 0) Week to Apr 12, 2019: 3 rigs total (Oil 0, Gas 3, Miscellaneous 0) Week to Apr 18, 2019: 3 rigs total (Oil 0, Gas 3, Miscellaneous 0) Week to Apr 26, 2019: 3 rigs total (Oil 0, Gas 3, Miscellaneous 0) Week to May 3, 2019: 4 rigs total (Oil 1, Gas 3, Miscellaneous 0) Week to May 10, 2019: 4 rigs total (Oil 1, Gas 3, Miscellaneous 0) Week to May 17, 2019: 5 rigs total (Oil 1, Gas 4, Miscellaneous 0) Week to May 24, 2019: 5 rigs total (Oil 1, Gas 4, Miscellaneous 0) Week to May 31, 2019: 5 rigs total (Oil 1, Gas 4, Miscellaneous 0) Week to Jun 7, 2019: 5 rigs total (Oil 1, Gas 4, Miscellaneous 0) Week to Jun 14, 2019: 8 rigs total (Oil 4, Gas 4, Miscellaneous 0) Week to Jun 21, 2019: 8 rigs total (Oil 4, Gas 4, Miscellaneous 0) Week to Jun 28, 2019: 7 rigs total (Oil 3, Gas 4, Miscellaneous 0) Week to Jul 3, 2019: 7 rigs total (Oil 3, Gas 4, Miscellaneous 0) Week to Jul 12, 2019: 6 rigs total (Oil 2, Gas 4, Miscellaneous 0) Week to Jul 19, 2019: 6 rigs total (Oil 2, Gas 4, Miscellaneous 0) Week to Jul 26, 2019: 6 rigs total (Oil 2, Gas 4, Miscellaneous 0) Week to Aug 2, 2019: 5 rigs total (Oil 2, Gas 3, Miscellaneous 0) Week to Aug 9, 2019: 6 rigs total (Oil 3, Gas 3, Miscellaneous 0) Week to Aug 16, 2019: 6 rigs total (Oil 3, Gas 3, Miscellaneous 0) Week to Aug 23, 2019: 6 rigs total (Oil 3, Gas 3, Miscellaneous 0) Week to Aug 30, 2019: 5 rigs total (Oil 2, Gas 3, Miscellaneous 0) Week to Sep 6, 2019: 4 rigs total (Oil 1, Gas 3, Miscellaneous 0) Week to Sep 13, 2019: 2 rigs total (Oil 1, Gas 1, Miscellaneous 0) Week to Sep 20, 2019: 2 rigs total (Oil 1, Gas 1, Miscellaneous 0) Week to Sep 27, 2019: 2 rigs total (Oil 1, Gas 1, Miscellaneous 0) Week to Oct 4, 2019: 2 rigs total (Oil 1, Gas 1, Miscellaneous 0) Week to Oct 11, 2019: 2 rigs total (Oil 1, Gas 1, Miscellaneous 0) Week to Oct 18, 2019: 1 rig total (Oil 1, Gas 0, Miscellaneous 0) Week to Oct 25, 2019: 1 rig total (Oil 1, Gas 0, Miscellaneous 0) Week to Nov 1, 2019: 1 rig total (Oil 1, Gas 0, Miscellaneous 0) Week to Nov 8, 2019: 1 rig total (Oil 1, Gas 0, Miscellaneous 0) Week to Nov 15, 2019: 1 rig total (Oil 1, Gas 0, Miscellaneous 0) Week to Nov 22, 2019: 1 rig total (Oil 0, Gas 1, Miscellaneous 0) Week to Nov 27, 2019: 1 rig total (Oil 0, Gas 1, Miscellaneous 0) Week to Dec 6, 2019: 1 rig total (Oil 0, Gas 1, Miscellaneous 0) Week to Dec 13, 2019: 1 rig total (Oil 1, Gas 0, Miscellaneous 0) Week to Dec 20, 2019: 1 rig total (Oil 1, Gas 0, Miscellaneous 0) Week to Dec 27, 2019: 1 rig total (Oil 1, Gas 0, Miscellaneous 0) Week to Jan 3, 2020: 1 rig total (Oil 1, Gas 0, Miscellaneous 0) Week to Jan 10, 2020: 1 rig total (Oil 1, Gas 0, Miscellaneous 0) Week to Jan 17, 2020: 1 rig total (Oil 1, Gas 0, Miscellaneous 0) Week to Jan 24, 2020: 1 rig total (Oil 1, Gas 0, Miscellaneous 0) Week to Jan 31, 2020: 0 rigs total (Oil 0, Gas 0, Miscellaneous 0) Week to Feb 7, 2020: 0 rigs total (Oil 0, Gas 0, Miscellaneous 0) Week to Feb 14, 2020: 0 rigs total (Oil 0, Gas 0, Miscellaneous 0) Week to Feb 21, 2020: 0 rigs total (Oil 0, Gas 0, Miscellaneous 0) Week to Feb 28, 2020: 0 rigs total (Oil 0, Gas 0, Miscellaneous 0) Week to Mar 6, 2020: 0 rigs total (Oil 0, Gas 0, Miscellaneous 0) Week to Mar 13, 2020: 0 rigs total (Oil 0, Gas 0, Miscellaneous 0) Week to Mar 20, 2020: 0 rigs total (Oil 0, Gas 0, Miscellaneous 0) Week to Mar 27, 2020: 0 rigs total (Oil 0, Gas 0, Miscellaneous 0) Week to Apr 3, 2020: 0 rigs total (Oil 0, Gas 0, Miscellaneous 0) Week to Apr 9, 2020: 0 rigs total (Oil 0, Gas 0, Miscellaneous 0) Week to Apr 17, 2020: 0 rigs total (Oil 0, Gas 0, Miscellaneous 0) Week to Apr 24, 2020: 0 rigs total (Oil 0, Gas 0, Miscellaneous 0) Week to May 1, 2020: 0 rigs total (Oil 0, Gas 0, Miscellaneous 0) Week to May 8, 2020: 0 rigs total (Oil 0, Gas 0, Miscellaneous 0) Week to May 15, 2020: 0 rigs total (Oil 0, Gas 0, Miscellaneous 0) Week to May 22, 2020: 0 rigs total (Oil 0, Gas 0, Miscellaneous 0) Week to May 29, 2020: 0 rigs total (Oil 0, Gas 0, Miscellaneous 0) Week to Jun 5, 2020: 0 rigs total (Oil 0, Gas 0, Miscellaneous 0) Week to Jun 12, 2020: 0 rigs total (Oil 0, Gas 0, Miscellaneous 0) Week to Jun 19, 2020: 0 rigs total (Oil 0, Gas 0, Miscellaneous 0) Week to Jun 26, 2020: 0 rigs total (Oil 0, Gas 0, Miscellaneous 0) Week to Jul 2, 2020: 0 rigs total (Oil 0, Gas 0, Miscellaneous 0) Week to Jul 10, 2020: 0 rigs total (Oil 0, Gas 0, Miscellaneous 0) Week to Jul 17, 2020: 0 rigs total (Oil 0, Gas 0, Miscellaneous 0) Week to Jul 24, 2020: 0 rigs total (Oil 0, Gas 0, Miscellaneous 0) Week to Jul 31, 2020: 0 rigs total (Oil 0, Gas 0, Miscellaneous 0) Week to Aug 7, 2020: 0 rigs total (Oil 0, Gas 0, Miscellaneous 0) Week to Aug 14, 2020: 0 rigs total (Oil 0, Gas 0, Miscellaneous 0) Week to Aug 21, 2020: 1 rig total (Oil 0, Gas 1, Miscellaneous 0) Week to Aug 28, 2020: 1 rig total (Oil 0, Gas 1, Miscellaneous 0) Week to Sep 4, 2020: 1 rig total (Oil 0, Gas 1, Miscellaneous 0) Week to Sep 11, 2020: 1 rig total (Oil 0, Gas 1, Miscellaneous 0) Week to Sep 18, 2020: 1 rig total (Oil 0, Gas 1, Miscellaneous 0) Week to Sep 25, 2020: 1 rig total (Oil 0, Gas 1, Miscellaneous 0) Week to Oct 2, 2020: 1 rig total (Oil 0, Gas 1, Miscellaneous 0) Week to Oct 9, 2020: 1 rig total (Oil 0, Gas 1, Miscellaneous 0) Week to Oct 16, 2020: 1 rig total (Oil 1, Gas 0, Miscellaneous 0) Week to Oct 23, 2020: 1 rig total (Oil 1, Gas 0, Miscellaneous 0) Week to Oct 30, 2020: 1 rig total (Oil 1, Gas 0, Miscellaneous 0) Week to Nov 6, 2020: 2 rigs total (Oil 1, Gas 1, Miscellaneous 0) Week to Nov 13, 2020: 2 rigs total (Oil 1, Gas 1, Miscellaneous 0) Week to Nov 20, 2020: 1 rig total (Oil 0, Gas 1, Miscellaneous 0) Week to Nov 25, 2020: 1 rig total (Oil 0, Gas 1, Miscellaneous 0) Week to Dec 4, 2020: 1 rig total (Oil 0, Gas 1, Miscellaneous 0) Week to Dec 11, 2020: 1 rig total (Oil 0, Gas 1, Miscellaneous 0) Week to Dec 18, 2020: 1 rig total (Oil 0, Gas 1, Miscellaneous 0) Week to Dec 23, 2020: 1 rig total (Oil 0, Gas 1, Miscellaneous 0) Week to Dec 31, 2020: 1 rig total (Oil 0, Gas 1, Miscellaneous 0) Week to Jan 8, 2021: 1 rig total (Oil 0, Gas 1, Miscellaneous 0) Week to Jan 15, 2021: 1 rig total (Oil 0, Gas 1, Miscellaneous 0) Week to Jan 22, 2021: 1 rig total (Oil 0, Gas 1, Miscellaneous 0) Week to Jan 29, 2021: 1 rig total (Oil 0, Gas 1, Miscellaneous 0) Week to Feb 5, 2021: 1 rig total (Oil 0, Gas 1, Miscellaneous 0) Week to Feb 12, 2021: 1 rig total (Oil 0, Gas 1, Miscellaneous 0) Week to Feb 19, 2021: 1 rig total (Oil 0, Gas 1, Miscellaneous 0) Week to Feb 26, 2021: 1 rig total (Oil 0, Gas 1, Miscellaneous 0) Week to Mar 5, 2021: 1 rig total (Oil 0, Gas 1, Miscellaneous 0) Week to Mar 12, 2021: 1 rig total (Oil 0, Gas 1, Miscellaneous 0) Week to Mar 19, 2021: 1 rig total (Oil 0, Gas 1, Miscellaneous 0) Week to Mar 26, 2021: 1 rig total (Oil 0, Gas 1, Miscellaneous 0) Week to Apr 1, 2021: 2 rigs total (Oil 1, Gas 1, Miscellaneous 0) Week to Apr 9, 2021: 2 rigs total (Oil 1, Gas 1, Miscellaneous 0) Week to Apr 16, 2021: 2 rigs total (Oil 1, Gas 1, Miscellaneous 0) Week to Apr 23, 2021: 2 rigs total (Oil 1, Gas 1, Miscellaneous 0) Week to Apr 30, 2021: 1 rig total (Oil 0, Gas 1, Miscellaneous 0) Week to May 7, 2021: 1 rig total (Oil 0, Gas 1, Miscellaneous 0) Week to May 14, 2021: 1 rig total (Oil 0, Gas 1, Miscellaneous 0) Week to May 21, 2021: 0 rigs total (Oil 0, Gas 0, Miscellaneous 0) Week to May 28, 2021: 0 rigs total (Oil 0, Gas 0, Miscellaneous 0) Week to Jun 4, 2021: 0 rigs total (Oil 0, Gas 0, Miscellaneous 0) Week to Jun 11, 2021: 0 rigs total (Oil 0, Gas 0, Miscellaneous 0) Week to Jun 18, 2021: 0 rigs total (Oil 0, Gas 0, Miscellaneous 0) Week to Jun 25, 2021: 0 rigs total (Oil 0, Gas 0, Miscellaneous 0) Week to Jul 2, 2021: 0 rigs total (Oil 0, Gas 0, Miscellaneous 0) Week to Jul 9, 2021: 0 rigs total (Oil 0, Gas 0, Miscellaneous 0) Week to Jul 16, 2021: 0 rigs total (Oil 0, Gas 0, Miscellaneous 0) Week to Jul 23, 2021: 0 rigs total (Oil 0, Gas 0, Miscellaneous 0) Week to Jul 30, 2021: 0 rigs total (Oil 0, Gas 0, Miscellaneous 0) Week to Aug 6, 2021: 0 rigs total (Oil 0, Gas 0, Miscellaneous 0) Week to Aug 13, 2021: 0 rigs total (Oil 0, Gas 0, Miscellaneous 0) Week to Aug 20, 2021: 0 rigs total (Oil 0, Gas 0, Miscellaneous 0) Week to Aug 27, 2021: 0 rigs total (Oil 0, Gas 0, Miscellaneous 0) Week to Sep 3, 2021: 0 rigs total (Oil 0, Gas 0, Miscellaneous 0) Week to Sep 10, 2021: 0 rigs total (Oil 0, Gas 0, Miscellaneous 0) Week to Sep 17, 2021: 0 rigs total (Oil 0, Gas 0, Miscellaneous 0) Week to Sep 24, 2021: 0 rigs total (Oil 0, Gas 0, Miscellaneous 0) Week to Oct 1, 2021: 0 rigs total (Oil 0, Gas 0, Miscellaneous 0) Week to Oct 8, 2021: 0 rigs total (Oil 0, Gas 0, Miscellaneous 0) Week to Oct 15, 2021: 0 rigs total (Oil 0, Gas 0, Miscellaneous 0) Week to Oct 22, 2021: 0 rigs total (Oil 0, Gas 0, Miscellaneous 0) Week to Oct 29, 2021: 0 rigs total (Oil 0, Gas 0, Miscellaneous 0) Week to Nov 5, 2021: 0 rigs total (Oil 0, Gas 0, Miscellaneous 0) Week to Nov 12, 2021: 0 rigs total (Oil 0, Gas 0, Miscellaneous 0) Week to Nov 19, 2021: 0 rigs total (Oil 0, Gas 0, Miscellaneous 0) Week to Nov 24, 2021: 1 rig total (Oil 0, Gas 1, Miscellaneous 0) Week to Dec 3, 2021: 1 rig total (Oil 0, Gas 1, Miscellaneous 0) Week to Dec 10, 2021: 1 rig total (Oil 0, Gas 1, Miscellaneous 0) Week to Dec 17, 2021: 1 rig total (Oil 0, Gas 1, Miscellaneous 0) Week to Dec 23, 2021: 1 rig total (Oil 0, Gas 1, Miscellaneous 0) Week to Dec 31, 2021: 1 rig total (Oil 0, Gas 1, Miscellaneous 0) Week to Jan 7, 2022: 1 rig total (Oil 0, Gas 1, Miscellaneous 0) Week to Jan 14, 2022: 1 rig total (Oil 0, Gas 1, Miscellaneous 0) Week to Jan 21, 2022: 1 rig total (Oil 0, Gas 1, Miscellaneous 0) Week to Jan 28, 2022: 1 rig total (Oil 0, Gas 1, Miscellaneous 0) Week to Feb 4, 2022: 1 rig total (Oil 0, Gas 1, Miscellaneous 0) Week to Feb 11, 2022: 1 rig total (Oil 0, Gas 1, Miscellaneous 0) Week to Feb 18, 2022: 0 rigs total (Oil 0, Gas 0, Miscellaneous 0) Week to Feb 25, 2022: 0 rigs total (Oil 0, Gas 0, Miscellaneous 0) Week to Mar 4, 2022: 0 rigs total (Oil 0, Gas 0, Miscellaneous 0) Week to Mar 11, 2022: 0 rigs total (Oil 0, Gas 0, Miscellaneous 0) Week to Mar 18, 2022: 0 rigs total (Oil 0, Gas 0, Miscellaneous 0) Week to Mar 25, 2022: 0 rigs total (Oil 0, Gas 0, Miscellaneous 0) Week to Apr 1, 2022: 0 rigs total (Oil 0, Gas 0, Miscellaneous 0) Week to Apr 8, 2022: 1 rig total (Oil 0, Gas 1, Miscellaneous 0) Week to Apr 14, 2022: 1 rig total (Oil 0, Gas 1, Miscellaneous 0) Week to Apr 22, 2022: 1 rig total (Oil 0, Gas 1, Miscellaneous 0) Week to Apr 29, 2022: 1 rig total (Oil 0, Gas 1, Miscellaneous 0) Week to May 6, 2022: 1 rig total (Oil 0, Gas 1, Miscellaneous 0) Week to May 13, 2022: 1 rig total (Oil 0, Gas 1, Miscellaneous 0) Week to May 20, 2022: 1 rig total (Oil 0, Gas 1, Miscellaneous 0) Week to May 27, 2022: 1 rig total (Oil 0, Gas 1, Miscellaneous 0) Week to Jun 3, 2022: 1 rig total (Oil 0, Gas 1, Miscellaneous 0) Week to Jun 10, 2022: 1 rig total (Oil 0, Gas 1, Miscellaneous 0) Week to Jun 17, 2022: 2 rigs total (Oil 0, Gas 2, Miscellaneous 0) Week to Jun 24, 2022: 2 rigs total (Oil 0, Gas 2, Miscellaneous 0) Week to Jul 1, 2022: 3 rigs total (Oil 1, Gas 2, Miscellaneous 0) Week to Jul 8, 2022: 3 rigs total (Oil 1, Gas 2, Miscellaneous 0) Week to Jul 15, 2022: 3 rigs total (Oil 1, Gas 2, Miscellaneous 0) Week to Jul 22, 2022: 3 rigs total (Oil 1, Gas 2, Miscellaneous 0) Week to Jul 29, 2022: 3 rigs total (Oil 1, Gas 2, Miscellaneous 0) Week to Aug 5, 2022: 3 rigs total (Oil 1, Gas 2, Miscellaneous 0) Week to Aug 12, 2022: 3 rigs total (Oil 1, Gas 2, Miscellaneous 0) Week to Aug 19, 2022: 3 rigs total (Oil 1, Gas 2, Miscellaneous 0) Week to Aug 26, 2022: 3 rigs total (Oil 1, Gas 2, Miscellaneous 0) Week to Sep 2, 2022: 3 rigs total (Oil 1, Gas 2, Miscellaneous 0) Week to Sep 9, 2022: 3 rigs total (Oil 1, Gas 2, Miscellaneous 0) Week to Sep 16, 2022: 3 rigs total (Oil 1, Gas 2, Miscellaneous 0) Week to Sep 23, 2022: 3 rigs total (Oil 1, Gas 2, Miscellaneous 0) Week to Sep 30, 2022: 3 rigs total (Oil 1, Gas 2, Miscellaneous 0) Week to Oct 7, 2022: 3 rigs total (Oil 1, Gas 2, Miscellaneous 0) Week to Oct 14, 2022: 3 rigs total (Oil 1, Gas 2, Miscellaneous 0) Week to Oct 21, 2022: 3 rigs total (Oil 1, Gas 2, Miscellaneous 0) Week to Oct 28, 2022: 3 rigs total (Oil 1, Gas 2, Miscellaneous 0) Week to Nov 4, 2022: 3 rigs total (Oil 1, Gas 2, Miscellaneous 0) Week to Nov 10, 2022: 3 rigs total (Oil 1, Gas 2, Miscellaneous 0) Week to Nov 18, 2022: 3 rigs total (Oil 1, Gas 2, Miscellaneous 0) Week to Nov 23, 2022: 3 rigs total (Oil 1, Gas 2, Miscellaneous 0) Week to Dec 2, 2022: 3 rigs total (Oil 1, Gas 2, Miscellaneous 0) Week to Dec 9, 2022: 3 rigs total (Oil 1, Gas 2, Miscellaneous 0) Week to Dec 16, 2022: 3 rigs total (Oil 1, Gas 2, Miscellaneous 0) Week to Dec 22, 2022: 3 rigs total (Oil 1, Gas 2, Miscellaneous 0) Week to Dec 30, 2022: 3 rigs total (Oil 1, Gas 2, Miscellaneous 0) Week to Jan 6, 2023: 3 rigs total (Oil 1, Gas 2, Miscellaneous 0) Week to Jan 13, 2023: 3 rigs total (Oil 1, Gas 2, Miscellaneous 0) Week to Jan 20, 2023: 3 rigs total (Oil 1, Gas 2, Miscellaneous 0) Week to Jan 27, 2023: 3 rigs total (Oil 1, Gas 2, Miscellaneous 0) Week to Feb 3, 2023: 3 rigs total (Oil 1, Gas 2, Miscellaneous 0) Week to Feb 10, 2023: 3 rigs total (Oil 1, Gas 2, Miscellaneous 0) Week to Feb 17, 2023: 3 rigs total (Oil 1, Gas 2, Miscellaneous 0) Week to Feb 24, 2023: 3 rigs total (Oil 1, Gas 2, Miscellaneous 0) Week to Mar 3, 2023: 3 rigs total (Oil 1, Gas 2, Miscellaneous 0) Week to Mar 10, 2023: 3 rigs total (Oil 1, Gas 2, Miscellaneous 0) Week to Mar 17, 2023: 2 rigs total (Oil 0, Gas 2, Miscellaneous 0) Week to Mar 24, 2023: 2 rigs total (Oil 0, Gas 2, Miscellaneous 0) Week to Mar 31, 2023: 2 rigs total (Oil 0, Gas 2, Miscellaneous 0) Week to Apr 6, 2023: 2 rigs total (Oil 0, Gas 2, Miscellaneous 0) Week to Apr 14, 2023: 2 rigs total (Oil 0, Gas 2, Miscellaneous 0) Week to Apr 21, 2023: 2 rigs total (Oil 0, Gas 2, Miscellaneous 0) Week to Apr 28, 2023: 2 rigs total (Oil 0, Gas 2, Miscellaneous 0) Week to May 5, 2023: 2 rigs total (Oil 0, Gas 2, Miscellaneous 0) Week to May 12, 2023: 7 rigs total (Oil 0, Gas 7, Miscellaneous 0) Week to May 19, 2023: 7 rigs total (Oil 0, Gas 7, Miscellaneous 0) Week to May 26, 2023: 7 rigs total (Oil 0, Gas 7, Miscellaneous 0) Week to Jun 2, 2023: 7 rigs total (Oil 0, Gas 7, Miscellaneous 0) Week to Jun 9, 2023: 7 rigs total (Oil 0, Gas 7, Miscellaneous 0) Week to Jun 16, 2023: 7 rigs total (Oil 0, Gas 7, Miscellaneous 0) Week to Jun 23, 2023: 8 rigs total (Oil 0, Gas 8, Miscellaneous 0) Week to Jun 30, 2023: 6 rigs total (Oil 0, Gas 6, Miscellaneous 0) Week to Jul 7, 2023: 7 rigs total (Oil 0, Gas 7, Miscellaneous 0) Week to Jul 14, 2023: 8 rigs total (Oil 0, Gas 8, Miscellaneous 0) Week to Jul 21, 2023: 7 rigs total (Oil 0, Gas 7, Miscellaneous 0) Week to Jul 28, 2023: 6 rigs total (Oil 0, Gas 6, Miscellaneous 0) Week to Aug 4, 2023: 6 rigs total (Oil 0, Gas 6, Miscellaneous 0) Week to Aug 11, 2023: 6 rigs total (Oil 0, Gas 6, Miscellaneous 0) Week to Aug 18, 2023: 4 rigs total (Oil 0, Gas 4, Miscellaneous 0) Week to Aug 25, 2023: 4 rigs total (Oil 0, Gas 4, Miscellaneous 0) Week to Sep 1, 2023: 4 rigs total (Oil 0, Gas 4, Miscellaneous 0) Week to Sep 8, 2023: 4 rigs total (Oil 0, Gas 4, Miscellaneous 0) Week to Sep 15, 2023: 4 rigs total (Oil 0, Gas 4, Miscellaneous 0) Week to Sep 22, 2023: 4 rigs total (Oil 0, Gas 4, Miscellaneous 0) Week to Sep 29, 2023: 4 rigs total (Oil 1, Gas 3, Miscellaneous 0) Week to Oct 6, 2023: 4 rigs total (Oil 1, Gas 3, Miscellaneous 0) Week to Oct 13, 2023: 4 rigs total (Oil 1, Gas 3, Miscellaneous 0) Week to Oct 20, 2023: 5 rigs total (Oil 2, Gas 3, Miscellaneous 0) Week to Oct 27, 2023: 5 rigs total (Oil 2, Gas 3, Miscellaneous 0) Week to Nov 3, 2023: 6 rigs total (Oil 2, Gas 4, Miscellaneous 0) Week to Nov 10, 2023: 6 rigs total (Oil 2, Gas 4, Miscellaneous 0) Week to Nov 17, 2023: 6 rigs total (Oil 2, Gas 4, Miscellaneous 0) Week to Nov 22, 2023: 6 rigs total (Oil 2, Gas 4, Miscellaneous 0) Week to Dec 1, 2023: 6 rigs total (Oil 2, Gas 4, Miscellaneous 0) Week to Dec 8, 2023: 6 rigs total (Oil 2, Gas 4, Miscellaneous 0) Week to Dec 15, 2023: 6 rigs total (Oil 2, Gas 4, Miscellaneous 0) Week to Dec 21, 2023: 6 rigs total (Oil 1, Gas 5, Miscellaneous 0) Week to Dec 29, 2023: 6 rigs total (Oil 1, Gas 5, Miscellaneous 0) Week to Jan 5, 2024: 6 rigs total (Oil 1, Gas 5, Miscellaneous 0) Week to Jan 12, 2024: 6 rigs total (Oil 1, Gas 5, Miscellaneous 0) Week to Jan 19, 2024: 6 rigs total (Oil 1, Gas 5, Miscellaneous 0) Week to Jan 26, 2024: 6 rigs total (Oil 1, Gas 5, Miscellaneous 0) Week to Feb 2, 2024: 5 rigs total (Oil 1, Gas 4, Miscellaneous 0) Week to Feb 9, 2024: 5 rigs total (Oil 1, Gas 4, Miscellaneous 0) Week to Feb 16, 2024: 5 rigs total (Oil 1, Gas 4, Miscellaneous 0) Week to Feb 23, 2024: 5 rigs total (Oil 1, Gas 4, Miscellaneous 0) Week to Mar 1, 2024: 5 rigs total (Oil 1, Gas 4, Miscellaneous 0) Week to Mar 8, 2024: 5 rigs total (Oil 1, Gas 4, Miscellaneous 0) Week to Mar 15, 2024: 5 rigs total (Oil 1, Gas 4, Miscellaneous 0) Week to Mar 22, 2024: 5 rigs total (Oil 1, Gas 4, Miscellaneous 0) Week to Mar 28, 2024: 5 rigs total (Oil 1, Gas 4, Miscellaneous 0) Week to Apr 5, 2024: 6 rigs total (Oil 1, Gas 5, Miscellaneous 0) Week to Apr 12, 2024: 6 rigs total (Oil 1, Gas 5, Miscellaneous 0) Week to Apr 19, 2024: 6 rigs total (Oil 1, Gas 5, Miscellaneous 0) Week to Apr 26, 2024: 6 rigs total (Oil 1, Gas 5, Miscellaneous 0) Week to May 3, 2024: 6 rigs total (Oil 1, Gas 5, Miscellaneous 0) Week to May 10, 2024: 6 rigs total (Oil 1, Gas 5, Miscellaneous 0) Week to May 17, 2024: 6 rigs total (Oil 1, Gas 5, Miscellaneous 0) Week to May 24, 2024: 5 rigs total (Oil 1, Gas 4, Miscellaneous 0) Week to May 31, 2024: 5 rigs total (Oil 1, Gas 4, Miscellaneous 0) Week to Jun 7, 2024: 5 rigs total (Oil 1, Gas 4, Miscellaneous 0) Week to Jun 14, 2024: 6 rigs total (Oil 1, Gas 5, Miscellaneous 0) Week to Jun 21, 2024: 5 rigs total (Oil 1, Gas 4, Miscellaneous 0) Week to Jun 28, 2024: 5 rigs total (Oil 1, Gas 4, Miscellaneous 0) Week to Jul 5, 2024: 5 rigs total (Oil 1, Gas 4, Miscellaneous 0) Week to Jul 12, 2024: 5 rigs total (Oil 1, Gas 4, Miscellaneous 0) Week to Jul 19, 2024: 5 rigs total (Oil 1, Gas 4, Miscellaneous 0) Week to Jul 26, 2024: 5 rigs total (Oil 1, Gas 4, Miscellaneous 0) Week to Aug 2, 2024: 4 rigs total (Oil 1, Gas 3, Miscellaneous 0) Week to Aug 9, 2024: 5 rigs total (Oil 1, Gas 4, Miscellaneous 0) Week to Aug 16, 2024: 5 rigs total (Oil 1, Gas 4, Miscellaneous 0) Week to Aug 23, 2024: 4 rigs total (Oil 1, Gas 3, Miscellaneous 0) Week to Aug 30, 2024: 4 rigs total (Oil 1, Gas 3, Miscellaneous 0) Week to Sep 6, 2024: 4 rigs total (Oil 1, Gas 3, Miscellaneous 0) Week to Sep 13, 2024: 5 rigs total (Oil 1, Gas 4, Miscellaneous 0) Week to Sep 20, 2024: 5 rigs total (Oil 1, Gas 4, Miscellaneous 0) Week to Sep 27, 2024: 6 rigs total (Oil 1, Gas 5, Miscellaneous 0) Week to Oct 4, 2024: 6 rigs total (Oil 1, Gas 5, Miscellaneous 0) Week to Oct 11, 2024: 6 rigs total (Oil 1, Gas 5, Miscellaneous 0) Week to Oct 18, 2024: 6 rigs total (Oil 1, Gas 5, Miscellaneous 0) Week to Oct 25, 2024: 6 rigs total (Oil 1, Gas 5, Miscellaneous 0) Week to Nov 1, 2024: 6 rigs total (Oil 1, Gas 5, Miscellaneous 0) Week to Nov 8, 2024: 5 rigs total (Oil 1, Gas 4, Miscellaneous 0) Week to Nov 15, 2024: 5 rigs total (Oil 1, Gas 4, Miscellaneous 0) Week to Nov 22, 2024: 4 rigs total (Oil 1, Gas 3, Miscellaneous 0) Week to Nov 27, 2024: 4 rigs total (Oil 1, Gas 3, Miscellaneous 0) Week to Dec 6, 2024: 5 rigs total (Oil 1, Gas 4, Miscellaneous 0) Week to Dec 13, 2024: 6 rigs total (Oil 1, Gas 5, Miscellaneous 0) Week to Dec 20, 2024: 6 rigs total (Oil 1, Gas 5, Miscellaneous 0) Week to Dec 27, 2024: 6 rigs total (Oil 1, Gas 5, Miscellaneous 0) Week to Jan 3, 2025: 6 rigs total (Oil 1, Gas 5, Miscellaneous 0) Week to Jan 10, 2025: 6 rigs total (Oil 1, Gas 5, Miscellaneous 0) Week to Jan 17, 2025: 6 rigs total (Oil 1, Gas 5, Miscellaneous 0) Week to Jan 24, 2025: 6 rigs total (Oil 1, Gas 5, Miscellaneous 0) Week to Jan 31, 2025: 6 rigs total (Oil 1, Gas 5, Miscellaneous 0) Week to Feb 7, 2025: 4 rigs total (Oil 1, Gas 3, Miscellaneous 0) Week to Feb 14, 2025: 4 rigs total (Oil 1, Gas 3, Miscellaneous 0) Week to Feb 21, 2025: 4 rigs total (Oil 1, Gas 3, Miscellaneous 0) Week to Feb 28, 2025: 5 rigs total (Oil 1, Gas 4, Miscellaneous 0) Week to Mar 7, 2025: 5 rigs total (Oil 1, Gas 4, Miscellaneous 0) Week to Mar 14, 2025: 5 rigs total (Oil 1, Gas 4, Miscellaneous 0) Week to Mar 21, 2025: 5 rigs total (Oil 1, Gas 4, Miscellaneous 0) Week to Mar 28, 2025: 5 rigs total (Oil 1, Gas 4, Miscellaneous 0) Week to Apr 4, 2025: 5 rigs total (Oil 1, Gas 4, Miscellaneous 0) Week to Apr 11, 2025: 5 rigs total (Oil 1, Gas 4, Miscellaneous 0) Week to Apr 17, 2025: 4 rigs total (Oil 1, Gas 3, Miscellaneous 0) Week to Apr 25, 2025: 4 rigs total (Oil 1, Gas 3, Miscellaneous 0) Week to May 2, 2025: 4 rigs total (Oil 1, Gas 3, Miscellaneous 0) Week to May 9, 2025: 3 rigs total (Oil 0, Gas 3, Miscellaneous 0) Week to May 16, 2025: 3 rigs total (Oil 0, Gas 3, Miscellaneous 0) Week to May 23, 2025: 3 rigs total (Oil 0, Gas 3, Miscellaneous 0) Week to May 30, 2025: 3 rigs total (Oil 0, Gas 3, Miscellaneous 0) Week to Jun 6, 2025: 3 rigs total (Oil 0, Gas 3, Miscellaneous 0) Week to Jun 13, 2025: 3 rigs total (Oil 0, Gas 3, Miscellaneous 0) Week to Jun 20, 2025: 2 rigs total (Oil 0, Gas 2, Miscellaneous 0) Week to Jun 27, 2025: 2 rigs total (Oil 0, Gas 2, Miscellaneous 0) Week to Jul 3, 2025: 2 rigs total (Oil 0, Gas 2, Miscellaneous 0) Week to Jul 11, 2025: 2 rigs total (Oil 0, Gas 2, Miscellaneous 0) Week to Jul 18, 2025: 2 rigs total (Oil 0, Gas 2, Miscellaneous 0) Week to Jul 25, 2025: 2 rigs total (Oil 0, Gas 2, Miscellaneous 0) Week to Aug 1, 2025: 2 rigs total (Oil 0, Gas 2, Miscellaneous 0) Week to Aug 8, 2025: 2 rigs total (Oil 0, Gas 2, Miscellaneous 0) Week to Aug 15, 2025: 2 rigs total (Oil 1, Gas 1, Miscellaneous 0) Week to Aug 22, 2025: 2 rigs total (Oil 1, Gas 1, Miscellaneous 0) Week to Aug 29, 2025: 2 rigs total (Oil 1, Gas 1, Miscellaneous 0) Week to Sep 5, 2025: 3 rigs total (Oil 2, Gas 1, Miscellaneous 0) Week to Sep 12, 2025: 3 rigs total (Oil 2, Gas 1, Miscellaneous 0) Week to Sep 19, 2025: 2 rigs total (Oil 1, Gas 1, Miscellaneous 0) Week to Sep 26, 2025: 2 rigs total (Oil 1, Gas 1, Miscellaneous 0) Week to Oct 3, 2025: 2 rigs total (Oil 1, Gas 1, Miscellaneous 0) Week to Oct 10, 2025: 3 rigs total (Oil 1, Gas 2, Miscellaneous 0) Week to Oct 17, 2025: 3 rigs total (Oil 1, Gas 2, Miscellaneous 0) Week to Oct 24, 2025: 3 rigs total (Oil 1, Gas 2, Miscellaneous 0) Week to Oct 31, 2025: 3 rigs total (Oil 1, Gas 2, Miscellaneous 0) Week to Nov 6, 2025: 4 rigs total (Oil 1, Gas 3, Miscellaneous 0) Week to Nov 14, 2025: 4 rigs total (Oil 1, Gas 3, Miscellaneous 0) Week to Nov 21, 2025: 4 rigs total (Oil 1, Gas 3, Miscellaneous 0) Week to Nov 26, 2025: 4 rigs total (Oil 1, Gas 3, Miscellaneous 0) Week to Dec 4, 2025: 5 rigs total (Oil 2, Gas 3, Miscellaneous 0) Week to Dec 12, 2025: 5 rigs total (Oil 2, Gas 3, Miscellaneous 0) Week to Dec 19, 2025: 8 rigs total (Oil 2, Gas 4, Miscellaneous 2) Week to Dec 24, 2025: 8 rigs total (Oil 2, Gas 4, Miscellaneous 2) Week to Dec 30, 2025: 8 rigs total (Oil 2, Gas 4, Miscellaneous 2) Week to Jan 9, 2026: 9 rigs total (Oil 2, Gas 5, Miscellaneous 2) Week to Jan 16, 2026: 8 rigs total (Oil 2, Gas 4, Miscellaneous 2) Week to Jan 23, 2026: 8 rigs total (Oil 2, Gas 4, Miscellaneous 2) Week to Jan 30, 2026: 7 rigs total (Oil 2, Gas 4, Miscellaneous 1) Week to Feb 6, 2026: 6 rigs total (Oil 2, Gas 3, Miscellaneous 1) Week to Feb 13, 2026: 7 rigs total (Oil 2, Gas 4, Miscellaneous 1) Week to Feb 20, 2026: 6 rigs total (Oil 2, Gas 3, Miscellaneous 1) Week to Feb 27, 2026: 6 rigs total (Oil 2, Gas 3, Miscellaneous 1) Week to Mar 6, 2026: 6 rigs total (Oil 2, Gas 3, Miscellaneous 1) Week to Mar 13, 2026: 5 rigs total (Oil 1, Gas 3, Miscellaneous 1) Week to Mar 20, 2026: 4 rigs total (Oil 1, Gas 3, Miscellaneous 0) Week to Mar 27, 2026: 4 rigs total (Oil 1, Gas 3, Miscellaneous 0) Week to Apr 2, 2026: 4 rigs total (Oil 1, Gas 3, Miscellaneous 0) Week to Apr 10, 2026: 4 rigs total (Oil 1, Gas 3, Miscellaneous 0) Week to Apr 17, 2026: 5 rigs total (Oil 1, Gas 4, Miscellaneous 0) Week to Apr 24, 2026: 5 rigs total (Oil 1, Gas 4, Miscellaneous 0) Week to May 1, 2026: 4 rigs total (Oil 1, Gas 3, Miscellaneous 0) Week to May 8, 2026: 4 rigs total (Oil 1, Gas 3, Miscellaneous 0) Week to May 15, 2026: 3 rigs total (Oil 1, Gas 2, Miscellaneous 0) Week to May 22, 2026: 4 rigs total (Oil 1, Gas 3, Miscellaneous 0) Week to May 29, 2026: 4 rigs total (Oil 1, Gas 3, Miscellaneous 0) Week to Jun 5, 2026: 4 rigs total (Oil 1, Gas 3, Miscellaneous 0) Week to Jun 12, 2026: 3 rigs total (Oil 1, Gas 2, Miscellaneous 0) Week to Jun 18, 2026: 3 rigs total (Oil 1, Gas 2, Miscellaneous 0) Week to Jun 26, 2026: 4 rigs total (Oil 1, Gas 3, Miscellaneous 0) Week to Jul 2, 2026: 4 rigs total (Oil 1, Gas 3, Miscellaneous 0) Week to Jul 10, 2026: 4 rigs total (Oil 1, Gas 3, Miscellaneous 0) Week to Jul 17, 2026: 4 rigs total (Oil 1, Gas 3, Miscellaneous 0) Week to Jul 24, 2026: 4 rigs total (Oil 1, Gas 3, Miscellaneous 0) Week to Jul 31, 2026: 5 rigs total (Oil 1, Gas 4, Miscellaneous 0) Week to Aug 7, 2026: 4 rigs total (Oil 1, Gas 3, Miscellaneous 0) Week to Aug 14, 2026: 5 rigs total (Oil 1, Gas 4, Miscellaneous 0) Week to Aug 21, 2026: 5 rigs total (Oil 1, Gas 4, Miscellaneous 0) Week to Aug 28, 2026: 7 rigs total (Oil 0, Gas 7, Miscellaneous 0) Week to Sep 4, 2026: 7 rigs total (Oil 0, Gas 7, Miscellaneous 0) Week to Sep 11, 2026: 7 rigs total (Oil 0, Gas 7, Miscellaneous 0) Week to Sep 18, 2026: 7 rigs total (Oil 0, Gas 7, Miscellaneous 0) Week to Sep 25, 2026: 7 rigs total (Oil 0, Gas 7, Miscellaneous 0) Week to Oct 2, 2026: 7 rigs total (Oil 0, Gas 7, Miscellaneous 0) Week to Oct 9, 2026: 7 rigs total (Oil 0, Gas 7, Miscellaneous 0) Week to Oct 16, 2026: 6 rigs total (Oil 0, Gas 6, Miscellaneous 0)

Interactive chart. Focus it and use the left and right arrow keys to read each week, Page Up and Page Down to move a year, Home and End for the ends of the series. The full figures are also in the table below.

  • In the Ark-La-Tex, 6 drilling rigs were active in the week to October 16, 2026 (3 more than a year earlier).
  • Since Oct 2016, the weekly count peaked at 15 in Aug 2017.
  • Rig locations are rolled up to this supply area's footprint, and no rig counts toward two areas.
Average active rigs per month: full table
Month Oil-directedGas-directedMiscellaneousAll rigs
Oct 2026 (through October 16, 2026)06.506.5
Sep 20260707
Aug 20260.6505.6
Jul 202613.204.2
Jun 202612.603.6
May 202612.803.8
Apr 202613.504.5
Mar 20261.230.44.6
Feb 202623.216.2
Jan 202624.21.88
Dec 202523.61.26.8
Nov 20251304
Oct 20251203
Sep 20251.4102.4
Aug 20250.81.202
Jul 20250202
Jun 202502.402.4
May 20250303
Apr 202513.204.2
Mar 20251405
Feb 202513.204.2
Jan 20251506
Dec 202414.805.8
Nov 202413.504.5

Source: CommoVision (commovision.com)

Formations

A cross-section through the Texas side of the Ark-La-Tex, drawn across Robertson County.

Robertson County, Texas
-14,000-12,000-10,000-8,000-6,000-4,000-2,000ft TVDSSNacatochPecan GapAustin ChalkBudaEdwardsRodessaPettetTravis PeakCotton ValleyBossier051015WNWESEmiles along the line · dipping 128 ft/mi toward ESE (118°) · pale ribbon shows how certain each depth is
N1,446 producing wells (thinned)

10 formations along a 19-mile line, west-northwest to east-southeast.

Every depth drawn here is our own estimate, built from the curated formation tops of Texas wells across the basin. The pale ribbon along each boundary shows how certain that depth is. Where the ribbon is wider, the depth is less certain.

How these sections are built

Each section follows one straight line across its county, and the map beside it shows where that line runs.

West is on the left.

The depth of each formation along the line is estimated from the depths at which Texas wells across the basin met that formation, as recorded in their completion reports.

A formation is drawn where enough wells along the line place it and where it stands clear of the formation above or below.

Key numbers

39.9 Mbbl/d (est.) Jun 2026 oil production Jun 2026 is still filling in. The figure is the filings already in plus an estimate of the part not yet filed. The change compares this estimate with the same month last year. -16.1% vs Jun last year best estimate incl. allocated
779.4 MMcf/d (est.) Jun 2026 gas production Jun 2026 is still filling in. The figure is the filings already in plus an estimate of the part not yet filed. The change compares this estimate with the same month last year. -1.7% vs Jun last year best estimate incl. allocated
44.4 Mbbl/d 2025 oil production best estimate incl. allocated
810.2 MMcf/d 2025 gas production best estimate incl. allocated
89,967 wells Wells in the total footprint all formations & trajectories
15,339 wells Producing wells tracked trailing 12 months per region
31.6 Mbbl/d Existing wells, Jun 2027 forecast
623.7 MMcf/d Existing wells, Jun 2027 forecast

What we cover here

Each row names the grain a region’s production is held at. Where a source publishes at a coarser grain, the page says so.

DataGrainSinceBenchmark
Arkansas production well 1920-04 ~62–101% of EIA
Louisiana production well 1977-01 ~97–98% of EIA
Mississippi production well 1946-07 ~100–102% of EIA
Texas production well 1993-01 ~100% of EIA

Benchmark cells compare our series with the EIA’s published estimates.

About the EIA comparison

The two are produced differently: the EIA estimates from a survey of the largest operators and a model built to anticipate late filings, while the series compared here are rebuilt from the source’s own records as they arrive. Recent months can differ without either being wrong; the methodology page explains both methods.

Coverage rows for the Ark-La-Tex are regenerated at every build from the same catalog of sources the data is built from.

What the data shows

  • The Ark-La-Tex footprint produced 16.2 MMbbl of oil and 295.7 Bcf of natural gas in 2025.
  • Natural gas production in the Ark-La-Tex footprint peaked in 2008 at 893.1 Bcf; 2025 output of 295.7 Bcf ran at 33% of that peak.
  • Ark-La-Tex is a producing area, not a single rock target: the 89,967 wells here are grouped by where they are, across every formation and trajectory drilled inside it.
  • The figures here start in 1993, when Texas filings begin. Before that only Arkansas, Louisiana and Mississippi report, together 30% of the area's volume at that point, so the earlier years are not drawn as the whole area.
  • 15,339 producing wells tracked, trailing 12 months per region.

Start a free trial

Watch supply move as soon as its sources publish, with forecasts on 1.1+ million producing wells. The portal is open, with a real API and MCP access for AI tools.

What the trial includes

Data use is subject to our Terms of Service.