
Brazil Onshore
The Brazil Onshore footprint produced 31.0 MMbbl of oil and 313.7 Bcf of natural gas in 2025. 6,925 producing wells tracked, trailing 12 months per region.
- Oil production rose 4% in 2025 from 2024.
Production
- filling in (est. · missed) . Hatching marks our estimate of the volume still to be filed. That estimate draws on our own production forecast. A check on the forecast behind this estimate measured a miss. It updates as filings arrive
- estimated . Hatching marks our estimate. In the most recent months that is volume still to be filed. Past the divider it is our estimate of each whole month, built on any filings already in. Beyond the last filings it is our forecast.
In this view, hatching marks our estimate, and in the most recent months that is volume still to be filed. Past the divider, the chart continues only the bands it has drawn. Each band continues as our estimate, from any filings already in and then from our forecast, built by summing our per-well forecasts. The method behind each well is recorded with the forecast. The forward months cover existing wells only. How our methods work
All from what the source published. All held at well grain.
How the volume breaks down
- 100% Reported by the official source by well
Every barrel through June 2026 starts from what the official source published for those months. Measured over January 1945 to June 2026.
- filling in (est. · missed) . Hatching marks our estimate of the volume still to be filed. That estimate draws on our own production forecast. A check on the forecast behind this estimate measured a miss. It updates as filings arrive
- estimated . Hatching marks our estimate. In the most recent months that is volume still to be filed. Past the divider it is our estimate of each whole month, built on any filings already in. Beyond the last filings it is our forecast.
In this view, hatching marks our estimate, and in the most recent months that is volume still to be filed. Past the divider, the chart continues only the bands it has drawn. Each band continues as our estimate, from any filings already in and then from our forecast, built by summing our per-well forecasts. The method behind each well is recorded with the forecast. The forward months cover existing wells only. How our methods work
All from what the source published. All held at well grain.
How the volume breaks down
- 100% Reported by the official source by well
Every cubic foot through June 2026 starts from what the official source published for those months. Measured over January 1945 to June 2026.
The bands group wells by when they first produced.
About this chart
The stack shows what is holding today's rate up and how much of it is new drilling. In the reported months the bands draw the filings already in. The months still filling in are marked.
Annual table (full history)
| Year | Oil (MMbbl) | Gas produced (Bcf) |
|---|---|---|
| 2025 | 31.0 | 314 |
| 2024 | 29.7 | 301 |
| 2023 | 26.0 | 248 |
| 2022 | 27.2 | 244 |
| 2021 | 31.4 | 293 |
| 2020 | 34.6 | 264 |
| 2019 | 37.9 | 293 |
| 2018 | 40.6 | 283 |
| 2017 | 46.4 | 277 |
| 2016 | 54.8 | 307 |
| 2015 | 58.4 | 296 |
| 2014 | 61.7 | 300 |
| 2013 | 64.0 | 265 |
| 2012 | 66.1 | 216 |
| 2011 | 66.5 | 216 |
| 2010 | 66.0 | 212 |
| 2009 | 65.5 | 212 |
| 2008 | 66.2 | 220 |
| 2007 | 69.4 | 221 |
| 2006 | 70.7 | 234 |
| 2005 | 76.0 | 129 |
| 2004 | 80.1 | 46 |
| 2003 | 82.3 | 114 |
| 2002 | 80.0 | 217 |
| 2001 | 78.3 | 205 |
| 2000 | 77.4 | 184 |
| 1999 | 76.5 | 136 |
| 1998 | 77.6 | 133 |
| 1997 | 73.3 | 125 |
| 1996 | 72.7 | 117 |
| 1995 | 66.2 | 103 |
| 1994 | 66.1 | 100 |
| 1993 | 67.3 | 101 |
| 1992 | 69.8 | 97 |
| 1991 | 67.6 | 89 |
| 1990 | 70.9 | 82 |
| 1989 | 73.3 | 80 |
| 1988 | 68.0 | 74 |
| 1987 | 62.8 | 74 |
| 1986 | 62.0 | 74 |
| 1985 | 58.2 | 74 |
| 1984 | 54.9 | 73 |
| 1983 | 49.3 | 71 |
| 1982 | 44.1 | 55 |
| 1981 | 42.1 | 46 |
| 1980 | 39.7 | 43 |
| 1979 | 40.5 | 41 |
| 1978 | 43.3 | 42 |
| 1977 | 44.8 | 42 |
| 1976 | 49.5 | 49 |
| 1975 | 53.2 | 49 |
| 1974 | 56.4 | 46 |
| 1973 | 57.8 | 40 |
| 1972 | 58.0 | 42 |
| 1971 | 58.6 | 40 |
| 1970 | 57.7 | 43 |
| 1969 | 60.6 | 43 |
| 1968 | 55.2 | 34 |
| 1967 | 49.0 | 31 |
| 1966 | 38.8 | 27 |
| 1965 | 31.5 | 23 |
| 1964 | 30.6 | 18 |
| 1963 | 32.6 | 17 |
| 1962 | 30.4 | 17 |
| 1961 | 32.5 | 18 |
| 1960 | 28.2 | 18 |
| 1959 | 22.9 | 14 |
| 1958 | 18.2 | 9 |
| 1957 | 9.7 | 5 |
| 1956 | 3.9 | 3 |
| 1955 | 1.9 | 2 |
| 1954 | 1.0 | 2 |
| 1953 | 0.9 | 1 |
| 1952 | 0.7 | <1 |
| 1951 | 0.6 | <1 |
| 1950 | 0.3 | 1 |
| 1949 | 0.1 | <1 |
| 1948 | 0.1 | <1 |
| 1947 | 0.1 | <1 |
| 1946 | 0.1 | <1 |
| 1945 | 0.1 | <1 |
Source: CommoVision (commovision.com)
Monthly table (last 24 months)
| Month | Oil (Mbbl) | Gas produced (MMcf) |
|---|---|---|
| 2026-06 | 2,435.8 | 28,533 |
| 2026-05 | 2,450.6 | 24,898 |
| 2026-03 | 2,123.5 | 27,040 |
| 2026-02 | 2,198.4 | 23,730 |
| 2026-01 | 2,440.4 | 27,323 |
| 2025-12 | 2,496.7 | 28,558 |
| 2025-11 | 2,464.6 | 27,453 |
| 2025-10 | 2,583.0 | 28,349 |
| 2025-09 | 2,631.9 | 28,697 |
| 2025-08 | 2,703.2 | 30,219 |
| 2025-07 | 2,703.0 | 28,931 |
| 2025-06 | 2,641.0 | 28,129 |
| 2025-05 | 2,719.9 | 23,398 |
| 2025-04 | 2,526.3 | 22,866 |
| 2025-03 | 2,536.3 | 21,847 |
| 2025-02 | 2,407.4 | 20,149 |
| 2025-01 | 2,611.6 | 25,127 |
| 2024-12 | 2,651.7 | 27,608 |
| 2024-11 | 2,474.3 | 26,854 |
| 2024-10 | 2,592.9 | 30,280 |
| 2024-09 | 2,444.1 | 29,513 |
| 2024-08 | 2,385.4 | 28,289 |
| 2024-07 | 2,431.6 | 26,671 |
Source: CommoVision (commovision.com)
Source: CommoVision · Brazil Onshore, data through June 2026.
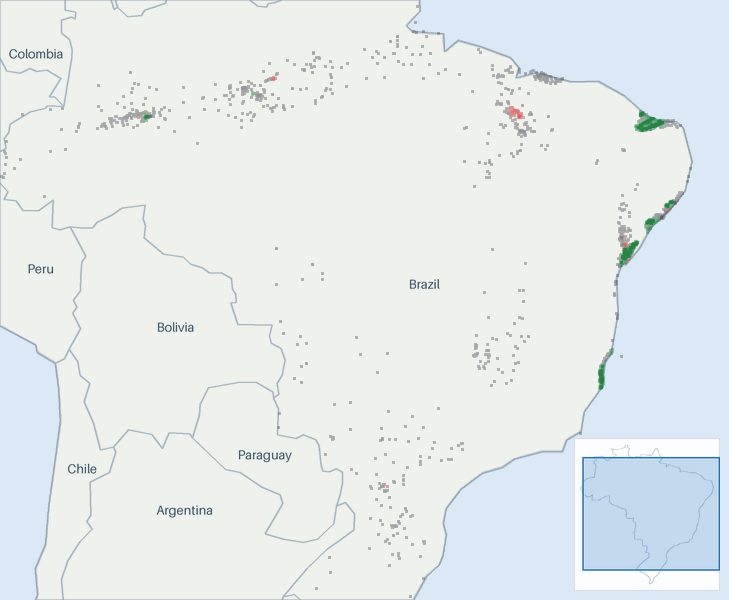
Well map
- Oil 16,472
- Natural gas 776
- Undetermined 6,789
About this map
Undetermined means not enough signal to settle it. Producing wells are the ones that reported oil or gas in the trailing 12 months per region.
Type curves
Average production per well, for wells grouped by when they first produced.
How these curves are built
Average daily production per well, for wells grouped by when they first produced. Includes every well of the cohort that is old enough at each month. Wells that are shut in or have stopped producing count as zero, so the average reflects the full cohort, not just survivors. Rates are calendar-day (volume ÷ days in month). The cumulative axis accumulates those same monthly averages at the average month length. Months not yet fully reported are excluded. The 2010-2014 curve draws those years as one group. The chart opens on average daily rate against months on production, the rate on a log scale. The view control switches to rate against cumulative production per well, on the same log rate scale, or to cumulative production per well against months on production, on a linear scale. Every view draws the same cohorts from the same production history. Each cohort is solid through the last month all the wells in its curve sit inside fully reported data. Past it the dashed curve carries the same wells forward, on our forecast where a well’s own record ends, for up to five years. A dashed curve runs as far as at least nine in ten of its wells are accounted for. A well that is old enough but shut in still counts, as zero. The measured months are what these wells reported. In the forward months each well counts its own reported figure for each month it has one, our forecast for each month it has only that, and zero for the rest. The forward average counts every well in the curve. The drawn forecast runs up to five years past the measured months. Line thickness tracks the size of each cohort.
Cohort summary table
| First produced | Wells in curve | Peak oil (bbl/d per well) | Month-12 oil (bbl/d per well) | Cum oil in series (Mbbl per well) | Peak gas (Mcf/d per well) | Month-12 gas (Mcf/d per well) | Cum gas in series (Bcf per well) | Months in series | Wells old enough at last month in series | Forecast months drawn |
|---|---|---|---|---|---|---|---|---|---|---|
| 2026 | 100 | 28.3 | — | 0.9 | 124 | — | 0.0 | 1 | 100% | 60 |
| 2025 | 149 | 36.4 | — | 5.4 | 144 | — | 0.0 | 7 | 100% | 60 |
| 2024 | 135 | 58.9 | 41.1 | 25.0 | 122 | 66.2 | 0.0 | 19 | 100% | 60 |
| 2023 | 115 | 23.1 | 13.8 | 13.8 | 166 | 83.4 | 0.1 | 31 | 100% | 60 |
| 2022 | 81 | 98.9 | 36.4 | 42.9 | 194 | 92.4 | 0.2 | 43 | 100% | 60 |
| 2021 | 47 | 55.5 | 26.7 | 37.2 | 825 | 83 | 0.4 | 55 | 100% | 60 |
| 2020 | 80 | 74.6 | 30.9 | 60.7 | 904 | 374 | 0.9 | 67 | 100% | 60 |
| 2019 | 80 | 68.9 | 57.2 | 71.0 | 116 | 33.6 | 0.1 | 79 | 100% | 60 |
| 2018 | 143 | 33.8 | 24.7 | 39.4 | 116 | 98.6 | 0.2 | 91 | 100% | 60 |
| 2017 | 121 | 18.6 | 16.1 | 20.2 | 619 | 4.8 | 0.6 | 103 | 100% | 60 |
| 2016 | 264 | 22.7 | 14.1 | 27.1 | 505 | 217 | 0.7 | 115 | 100% | 60 |
| 2015 | 479 | 30.3 | 22.8 | 43.7 | 200 | 178 | 0.3 | 127 | 100% | 60 |
| 2010-2014 | 1,976 | 71 | 42.8 | 92.7 | 295 | 283 | 0.8 | 139 | 100% | 60 |
Source: CommoVision (commovision.com)
Source: CommoVision · Brazil Onshore type curves, per-well production by first-production cohort.
Top operators in Brazil Onshore, 2025
Top operators in Brazil Onshore, 2025: full table
| Operator | Oil (Mbbl/d, 2025) | Gas produced (MMcf/d, 2025) | Share of output |
|---|---|---|---|
| Petrobras | 51.5 | 497.0 | 59.5% |
| PetroRecôncavo S.A. | 16.2 | 61.9 | 14.3% |
| Eneva S.A. | 0.3 | 190.2 | 9.1% |
| Brava Energia S.A. | 7.8 | 40.6 | 7.4% |
| Origem Energia S.A. | 3.4 | 47.9 | 4.6% |
| Seacrest SPE Cricaré S.A. | 1.7 | 1.2 | 1.2% |
| Carmo Energy S.A. | 1.7 | 0.2 | 1.2% |
| Imetame Energia S.A. | 0.7 | 7.2 | 0.8% |
| Alvopetro Energy Ltd. | 0.1 | 10.4 | 0.5% |
| Petrosynergy Ltda | 0.4 | 0.4 | 0.3% |
| 21 other operators | 1.3 | 1.7 | 1.0% |
Mbbl/d = thousand barrels per day · MMcf/d = million cubic feet per day (units).
Source: CommoVision (commovision.com)
Key numbers
What we cover here
Each row names the grain a region’s production is held at. Where a source publishes at a coarser grain, the page says so.
| Data | Grain | Since | Benchmark |
|---|---|---|---|
| Brazil production | well | 1941-12 | — |
Coverage rows for Brazil Onshore are regenerated at every build from the same catalog of sources the data is built from.
What the data shows
- The Brazil Onshore footprint produced 31.0 MMbbl of oil and 313.7 Bcf of natural gas in 2025.
- Oil production in the Brazil Onshore footprint peaked in 2003 at 82.3 MMbbl; 2025 output of 31.0 MMbbl ran at 38% of that peak.
- Brazil Onshore is a producing area, not a single rock target: the 24,047 wells here are grouped by where they are, across every formation and trajectory drilled inside it.
- 6,925 producing wells tracked, trailing 12 months per region.
Start a free trial
Watch supply move as soon as its sources publish, with forecasts on 1.1+ million producing wells. The portal is open, with a real API and MCP access for AI tools.
Data use is subject to our Terms of Service.