See oil & gas supply before the market does

Oil & gas production across the Americas: every producing country, well by well wherever wells are reported. New filings land as soon as their source publishes them, and every arrival is timed in the open. Forecasts carry the picture forward. Built for commodity traders and supply analysts.

  • Complete: the Americas, well by well 1.1+ million producing wells across the Americas, month by month, from the earliest records on file to the newest filing. Conventional and shale, oil and gas, onshore and offshore. Permits, completions, fracs, formation tops, tests and directional surveys sit in the same model. Where a source publishes at a coarser grain, the page says so.
  • Accurate: checked against the source’s own totals Volumes are checked against the totals their sources publish. A figure that includes allocated, adjusted, source-estimated, source-withheld, rate-derived or attributed volumes is labeled a best estimate. Each figure is judged at its own grain. Every best-estimate figure starts from what the source published for those months. Where a cohort of wells has been scored, the cohort’s forecast method is chosen by backtest against what those wells then produced.
  • Fresh: every arrival timed in the open New filings enter the product as soon as their source publishes them. Every arrival on this site is timed in the open, step by step.
  • Forward: forecasts built in A forward monthly profile built well by well for 1.1+ million producing wells, rebuilt as new volumes arrive and rolled up to any level you look at: company, area, state or country.
  • Open: API & MCP for AI tools Every figure carries its origin, and every data page a source line, the month its data runs through, and machine-readable dataset metadata, so a number can be cited with its month and its source. A real API and an MCP endpoint (the open standard AI assistants use to reach live data) open on October 1, 2026, with the portal.
Oil production across the Americas, by supply area (MMbbl/d, monthly)Latest: ≈29.3, Jul 2026 (est.)
Permian Western Canada Brazil Offshore Gulf of Mexico Mexico Bakken Eagle Ford Rest of the Americas filling in (est. · provisional) . Hatching marks our estimate of the volume still to be filed. That estimate draws on our own production forecast. This estimate is published as our best figure. No miss stands against it. It updates as filings arrive

Oil production across the Americas, by supply area: million barrels per day 10 20 30 40 MMbbl/d today 201020122014201620182020202220242026 Jan 2010: 15.9 MMbbl/d total Feb 2010: 16.3 MMbbl/d total Mar 2010: 16.3 MMbbl/d total Apr 2010: 16.2 MMbbl/d total May 2010: 16.3 MMbbl/d total Jun 2010: 16.2 MMbbl/d total Jul 2010: 16.2 MMbbl/d total Aug 2010: 16.4 MMbbl/d total Sep 2010: 16.3 MMbbl/d total Oct 2010: 16.4 MMbbl/d total Nov 2010: 16.6 MMbbl/d total Dec 2010: 16.6 MMbbl/d total Jan 2011: 16.6 MMbbl/d total Feb 2011: 16.5 MMbbl/d total Mar 2011: 16.7 MMbbl/d total Apr 2011: 16.6 MMbbl/d total May 2011: 16.3 MMbbl/d total Jun 2011: 16.5 MMbbl/d total Jul 2011: 16.5 MMbbl/d total Aug 2011: 16.9 MMbbl/d total Sep 2011: 16.7 MMbbl/d total Oct 2011: 17.1 MMbbl/d total Nov 2011: 17.3 MMbbl/d total Dec 2011: 17.5 MMbbl/d total Jan 2012: 17.6 MMbbl/d total Feb 2012: 17.6 MMbbl/d total Mar 2012: 17.4 MMbbl/d total Apr 2012: 17.4 MMbbl/d total May 2012: 17.5 MMbbl/d total Jun 2012: 17.4 MMbbl/d total Jul 2012: 17.6 MMbbl/d total Aug 2012: 17.5 MMbbl/d total Sep 2012: 17.6 MMbbl/d total Oct 2012: 18.1 MMbbl/d total Nov 2012: 18.4 MMbbl/d total Dec 2012: 18.6 MMbbl/d total Jan 2013: 19.5 MMbbl/d total Feb 2013: 19.6 MMbbl/d total Mar 2013: 19.5 MMbbl/d total Apr 2013: 19.6 MMbbl/d total May 2013: 19.3 MMbbl/d total Jun 2013: 19.5 MMbbl/d total Jul 2013: 19.8 MMbbl/d total Aug 2013: 20.2 MMbbl/d total Sep 2013: 20.3 MMbbl/d total Oct 2013: 20.3 MMbbl/d total Nov 2013: 20.5 MMbbl/d total Dec 2013: 20.6 MMbbl/d total Jan 2014: 20.6 MMbbl/d total Feb 2014: 20.8 MMbbl/d total Mar 2014: 21 MMbbl/d total Apr 2014: 21.2 MMbbl/d total May 2014: 21.2 MMbbl/d total Jun 2014: 21.5 MMbbl/d total Jul 2014: 21.5 MMbbl/d total Aug 2014: 21.7 MMbbl/d total Sep 2014: 21.9 MMbbl/d total Oct 2014: 22.2 MMbbl/d total Nov 2014: 22.2 MMbbl/d total Dec 2014: 22.6 MMbbl/d total Jan 2015: 22.4 MMbbl/d total Feb 2015: 22.7 MMbbl/d total Mar 2015: 22.6 MMbbl/d total Apr 2015: 22.3 MMbbl/d total May 2015: 21.9 MMbbl/d total Jun 2015: 22 MMbbl/d total Jul 2015: 22.5 MMbbl/d total Aug 2015: 22.6 MMbbl/d total Sep 2015: 22 MMbbl/d total Oct 2015: 22.2 MMbbl/d total Nov 2015: 22.3 MMbbl/d total Dec 2015: 22.4 MMbbl/d total Jan 2016: 22 MMbbl/d total Feb 2016: 21.6 MMbbl/d total Mar 2016: 21.5 MMbbl/d total Apr 2016: 21 MMbbl/d total May 2016: 20.4 MMbbl/d total Jun 2016: 20.6 MMbbl/d total Jul 2016: 21 MMbbl/d total Aug 2016: 21.3 MMbbl/d total Sep 2016: 21.2 MMbbl/d total Oct 2016: 21.4 MMbbl/d total Nov 2016: 21.7 MMbbl/d total Dec 2016: 21.4 MMbbl/d total Jan 2017: 21.6 MMbbl/d total Feb 2017: 21.8 MMbbl/d total Mar 2017: 21.4 MMbbl/d total Apr 2017: 21 MMbbl/d total May 2017: 21.3 MMbbl/d total Jun 2017: 21.3 MMbbl/d total Jul 2017: 21.7 MMbbl/d total Aug 2017: 21.7 MMbbl/d total Sep 2017: 21.6 MMbbl/d total Oct 2017: 21.8 MMbbl/d total Nov 2017: 22.5 MMbbl/d total Dec 2017: 22.3 MMbbl/d total Jan 2018: 22.1 MMbbl/d total Feb 2018: 22.5 MMbbl/d total Mar 2018: 22.6 MMbbl/d total Apr 2018: 22.3 MMbbl/d total May 2018: 22.5 MMbbl/d total Jun 2018: 22.6 MMbbl/d total Jul 2018: 22.9 MMbbl/d total Aug 2018: 23.5 MMbbl/d total Sep 2018: 23.1 MMbbl/d total Oct 2018: 23.5 MMbbl/d total Nov 2018: 23.8 MMbbl/d total Dec 2018: 23.9 MMbbl/d total Jan 2019: 23.5 MMbbl/d total Feb 2019: 23.1 MMbbl/d total Mar 2019: 23.2 MMbbl/d total Apr 2019: 23.6 MMbbl/d total May 2019: 23.5 MMbbl/d total Jun 2019: 23.6 MMbbl/d total Jul 2019: 23.5 MMbbl/d total Aug 2019: 24.3 MMbbl/d total Sep 2019: 24.1 MMbbl/d total Oct 2019: 24.3 MMbbl/d total Nov 2019: 24.9 MMbbl/d total Dec 2019: 25.2 MMbbl/d total Jan 2020: 25.1 MMbbl/d total Feb 2020: 24.9 MMbbl/d total Mar 2020: 24.6 MMbbl/d total Apr 2020: 22.7 MMbbl/d total May 2020: 19.9 MMbbl/d total Jun 2020: 21.1 MMbbl/d total Jul 2020: 21.7 MMbbl/d total Aug 2020: 21.3 MMbbl/d total Sep 2020: 21.5 MMbbl/d total Oct 2020: 21.3 MMbbl/d total Nov 2020: 22.3 MMbbl/d total Dec 2020: 22.5 MMbbl/d total Jan 2021: 22.6 MMbbl/d total Feb 2021: 21.2 MMbbl/d total Mar 2021: 22.8 MMbbl/d total Apr 2021: 22.4 MMbbl/d total May 2021: 22.6 MMbbl/d total Jun 2021: 22.8 MMbbl/d total Jul 2021: 23.1 MMbbl/d total Aug 2021: 22.8 MMbbl/d total Sep 2021: 22.4 MMbbl/d total Oct 2021: 23.3 MMbbl/d total Nov 2021: 23.7 MMbbl/d total Dec 2021: 23.2 MMbbl/d total Jan 2022: 23.6 MMbbl/d total Feb 2022: 23.8 MMbbl/d total Mar 2022: 24.2 MMbbl/d total Apr 2022: 24.2 MMbbl/d total May 2022: 23.9 MMbbl/d total Jun 2022: 24.1 MMbbl/d total Jul 2022: 24.5 MMbbl/d total Aug 2022: 24.9 MMbbl/d total Sep 2022: 25.3 MMbbl/d total Oct 2022: 25.5 MMbbl/d total Nov 2022: 25.5 MMbbl/d total Dec 2022: 25 MMbbl/d total Jan 2023: 25.1 MMbbl/d total Feb 2023: 25.1 MMbbl/d total Mar 2023: 25.2 MMbbl/d total Apr 2023: 24.9 MMbbl/d total May 2023: 24.8 MMbbl/d total Jun 2023: 25.3 MMbbl/d total Jul 2023: 25.9 MMbbl/d total Aug 2023: 25.8 MMbbl/d total Sep 2023: 26 MMbbl/d total Oct 2023: 26 MMbbl/d total Nov 2023: 26.7 MMbbl/d total Dec 2023: 26.8 MMbbl/d total Jan 2024: 26.2 MMbbl/d total Feb 2024: 27 MMbbl/d total Mar 2024: 27 MMbbl/d total Apr 2024: 26.8 MMbbl/d total May 2024: 26.6 MMbbl/d total Jun 2024: 26.9 MMbbl/d total Jul 2024: 26.6 MMbbl/d total Aug 2024: 27.3 MMbbl/d total Sep 2024: 27 MMbbl/d total Oct 2024: 27.4 MMbbl/d total Nov 2024: 27.4 MMbbl/d total Dec 2024: 27.6 MMbbl/d total Jan 2025: 27.2 MMbbl/d total Feb 2025: 27.1 MMbbl/d total Mar 2025: 27.7 MMbbl/d total Apr 2025: 27.6 MMbbl/d total May 2025: 27.3 MMbbl/d total Jun 2025: 27.9 MMbbl/d total Jul 2025: 28.2 MMbbl/d total Aug 2025: 28.5 MMbbl/d total Sep 2025: 28.7 MMbbl/d total Oct 2025: 29 MMbbl/d total Nov 2025: 28.9 MMbbl/d total Dec 2025: 29 MMbbl/d total Jan 2026: 28.2 MMbbl/d total Feb 2026: 28.9 MMbbl/d total Mar 2026: 29.1 MMbbl/d total Apr 2026: ≈29.4 MMbbl/d total (97% arrived, remainder estimated) May 2026: ≈28.9 MMbbl/d total (97% arrived, remainder estimated) Jun 2026: ≈29 MMbbl/d total (92% arrived, remainder estimated) Jul 2026: ≈29.3 MMbbl/d total (80% arrived, remainder estimated)

Filings for the months past the chart are still arriving: Aug 2026 18%.

Interactive chart. Focus it and use the left and right arrow keys to read each month, Page Up and Page Down to move a year, Home and End for the ends of the series. The full figures are also in the table below.

99.99% from what the source published. 78.3% held at well grain. In the United States it is 99.0%.

How the volume breaks down
  • 66.4% Reported by the official source by well
  • 21.7% Reported by the official source as a lease, facility, field or state total. Published without per-well detail.
  • 11.4% Reported by the official source as a lease total, split across the lease's wells. The regional total shown is the reported number, to rounding.
  • 0.29% Reported by the official source for a longer period, spread across its months. The period total is the reported number.
  • under 0.01% A series adjusted so a total meets a published figure: a well's own cumulative from the official source, or a state's yearly total from a second official source.
  • 0.17% Published by the official source as its own estimate rather than an operator-attested figure
  • under 0.01% Filed with the official source, which withheld this period's production figure for one stream. That stream carries a placeholder zero.
  • 0.01% Derived from the source's reported daily rates: the month's average reported rate times its calendar days, with days the source did not report assumed at that average. Replaced by the source's own monthly total when one is published and the substitution passes our checks.

99.99% of the oil in the reported months starts from what the official source published for those months. Measured over January 2010 to March 2026.

Natural gas production across the Americas, by supply area (Bcf/d, monthly)Latest: ≈174, Jul 2026 (est.)
Appalachia Permian Western Canada Haynesville Eagle Ford Anadarko Niobrara Rest of the Americas filling in (est. · provisional) . Hatching marks our estimate of the volume still to be filed. That estimate draws on our own production forecast. This estimate is published as our best figure. No miss stands against it. It updates as filings arrive

Natural gas production across the Americas, by supply area: billion cubic feet per day 50 100 150 200 Bcf/d today 201020122014201620182020202220242026 Jan 2010: 100 Bcf/d total Feb 2010: 103 Bcf/d total Mar 2010: 104 Bcf/d total Apr 2010: 102 Bcf/d total May 2010: 102 Bcf/d total Jun 2010: 101 Bcf/d total Jul 2010: 99.6 Bcf/d total Aug 2010: 101 Bcf/d total Sep 2010: 103 Bcf/d total Oct 2010: 104 Bcf/d total Nov 2010: 105 Bcf/d total Dec 2010: 106 Bcf/d total Jan 2011: 102 Bcf/d total Feb 2011: 104 Bcf/d total Mar 2011: 107 Bcf/d total Apr 2011: 108 Bcf/d total May 2011: 105 Bcf/d total Jun 2011: 104 Bcf/d total Jul 2011: 103 Bcf/d total Aug 2011: 103 Bcf/d total Sep 2011: 105 Bcf/d total Oct 2011: 107 Bcf/d total Nov 2011: 110 Bcf/d total Dec 2011: 110 Bcf/d total Jan 2012: 110 Bcf/d total Feb 2012: 109 Bcf/d total Mar 2012: 109 Bcf/d total Apr 2012: 108 Bcf/d total May 2012: 108 Bcf/d total Jun 2012: 106 Bcf/d total Jul 2012: 105 Bcf/d total Aug 2012: 102 Bcf/d total Sep 2012: 106 Bcf/d total Oct 2012: 108 Bcf/d total Nov 2012: 110 Bcf/d total Dec 2012: 109 Bcf/d total Jan 2013: 112 Bcf/d total Feb 2013: 113 Bcf/d total Mar 2013: 111 Bcf/d total Apr 2013: 113 Bcf/d total May 2013: 112 Bcf/d total Jun 2013: 111 Bcf/d total Jul 2013: 111 Bcf/d total Aug 2013: 111 Bcf/d total Sep 2013: 112 Bcf/d total Oct 2013: 112 Bcf/d total Nov 2013: 114 Bcf/d total Dec 2013: 114 Bcf/d total Jan 2014: 115 Bcf/d total Feb 2014: 116 Bcf/d total Mar 2014: 115 Bcf/d total Apr 2014: 117 Bcf/d total May 2014: 117 Bcf/d total Jun 2014: 117 Bcf/d total Jul 2014: 115 Bcf/d total Aug 2014: 115 Bcf/d total Sep 2014: 118 Bcf/d total Oct 2014: 120 Bcf/d total Nov 2014: 123 Bcf/d total Dec 2014: 124 Bcf/d total Jan 2015: 123 Bcf/d total Feb 2015: 124 Bcf/d total Mar 2015: 122 Bcf/d total Apr 2015: 123 Bcf/d total May 2015: 121 Bcf/d total Jun 2015: 120 Bcf/d total Jul 2015: 120 Bcf/d total Aug 2015: 120 Bcf/d total Sep 2015: 122 Bcf/d total Oct 2015: 122 Bcf/d total Nov 2015: 124 Bcf/d total Dec 2015: 124 Bcf/d total Jan 2016: 124 Bcf/d total Feb 2016: 124 Bcf/d total Mar 2016: 123 Bcf/d total Apr 2016: 121 Bcf/d total May 2016: 121 Bcf/d total Jun 2016: 120 Bcf/d total Jul 2016: 119 Bcf/d total Aug 2016: 121 Bcf/d total Sep 2016: 120 Bcf/d total Oct 2016: 120 Bcf/d total Nov 2016: 122 Bcf/d total Dec 2016: 121 Bcf/d total Jan 2017: 122 Bcf/d total Feb 2017: 123 Bcf/d total Mar 2017: 123 Bcf/d total Apr 2017: 123 Bcf/d total May 2017: 122 Bcf/d total Jun 2017: 122 Bcf/d total Jul 2017: 121 Bcf/d total Aug 2017: 121 Bcf/d total Sep 2017: 124 Bcf/d total Oct 2017: 126 Bcf/d total Nov 2017: 130 Bcf/d total Dec 2017: 131 Bcf/d total Jan 2018: 130 Bcf/d total Feb 2018: 133 Bcf/d total Mar 2018: 132 Bcf/d total Apr 2018: 133 Bcf/d total May 2018: 133 Bcf/d total Jun 2018: 132 Bcf/d total Jul 2018: 135 Bcf/d total Aug 2018: 137 Bcf/d total Sep 2018: 138 Bcf/d total Oct 2018: 140 Bcf/d total Nov 2018: 142 Bcf/d total Dec 2018: 143 Bcf/d total Jan 2019: 143 Bcf/d total Feb 2019: 143 Bcf/d total Mar 2019: 142 Bcf/d total Apr 2019: 144 Bcf/d total May 2019: 143 Bcf/d total Jun 2019: 143 Bcf/d total Jul 2019: 143 Bcf/d total Aug 2019: 144 Bcf/d total Sep 2019: 146 Bcf/d total Oct 2019: 149 Bcf/d total Nov 2019: 152 Bcf/d total Dec 2019: 151 Bcf/d total Jan 2020: 150 Bcf/d total Feb 2020: 150 Bcf/d total Mar 2020: 148 Bcf/d total Apr 2020: 145 Bcf/d total May 2020: 137 Bcf/d total Jun 2020: 139 Bcf/d total Jul 2020: 141 Bcf/d total Aug 2020: 141 Bcf/d total Sep 2020: 141 Bcf/d total Oct 2020: 142 Bcf/d total Nov 2020: 145 Bcf/d total Dec 2020: 146 Bcf/d total Jan 2021: 147 Bcf/d total Feb 2021: 138 Bcf/d total Mar 2021: 146 Bcf/d total Apr 2021: 147 Bcf/d total May 2021: 147 Bcf/d total Jun 2021: 146 Bcf/d total Jul 2021: 147 Bcf/d total Aug 2021: 148 Bcf/d total Sep 2021: 148 Bcf/d total Oct 2021: 150 Bcf/d total Nov 2021: 154 Bcf/d total Dec 2021: 154 Bcf/d total Jan 2022: 152 Bcf/d total Feb 2022: 152 Bcf/d total Mar 2022: 153 Bcf/d total Apr 2022: 155 Bcf/d total May 2022: 155 Bcf/d total Jun 2022: 155 Bcf/d total Jul 2022: 157 Bcf/d total Aug 2022: 157 Bcf/d total Sep 2022: 158 Bcf/d total Oct 2022: 159 Bcf/d total Nov 2022: 161 Bcf/d total Dec 2022: 158 Bcf/d total Jan 2023: 162 Bcf/d total Feb 2023: 161 Bcf/d total Mar 2023: 161 Bcf/d total Apr 2023: 161 Bcf/d total May 2023: 160 Bcf/d total Jun 2023: 159 Bcf/d total Jul 2023: 160 Bcf/d total Aug 2023: 160 Bcf/d total Sep 2023: 161 Bcf/d total Oct 2023: 162 Bcf/d total Nov 2023: 165 Bcf/d total Dec 2023: 166 Bcf/d total Jan 2024: 163 Bcf/d total Feb 2024: 167 Bcf/d total Mar 2024: 163 Bcf/d total Apr 2024: 161 Bcf/d total May 2024: 160 Bcf/d total Jun 2024: 161 Bcf/d total Jul 2024: 162 Bcf/d total Aug 2024: 162 Bcf/d total Sep 2024: 161 Bcf/d total Oct 2024: 163 Bcf/d total Nov 2024: 165 Bcf/d total Dec 2024: 167 Bcf/d total Jan 2025: 166 Bcf/d total Feb 2025: 168 Bcf/d total Mar 2025: 168 Bcf/d total Apr 2025: 169 Bcf/d total May 2025: 170 Bcf/d total Jun 2025: 169 Bcf/d total Jul 2025: 170 Bcf/d total Aug 2025: 171 Bcf/d total Sep 2025: 171 Bcf/d total Oct 2025: 171 Bcf/d total Nov 2025: 175 Bcf/d total Dec 2025: 177 Bcf/d total Jan 2026: 174 Bcf/d total Feb 2026: 177 Bcf/d total Mar 2026: 178 Bcf/d total Apr 2026: ≈176 Bcf/d total (97% arrived, remainder estimated) May 2026: ≈175 Bcf/d total (97% arrived, remainder estimated) Jun 2026: ≈176 Bcf/d total (92% arrived, remainder estimated) Jul 2026: ≈174 Bcf/d total (80% arrived, remainder estimated)

Filings for the months past the chart are still arriving: Aug 2026 18%.

Interactive chart. Focus it and use the left and right arrow keys to read each month, Page Up and Page Down to move a year, Home and End for the ends of the series. The full figures are also in the table below.

All from what the source published. 97.9% held at well grain. In the United States it is 99.6%.

How the volume breaks down
  • 84.6% Reported by the official source by well
  • 2.1% Reported by the official source as a lease, facility, field or state total. Published without per-well detail.
  • 8.7% Reported by the official source as a lease total, split across the lease's wells. The regional total shown is the reported number, to rounding.
  • 4.6% Reported by the official source for a longer period, spread across its months. The period total is the reported number.
  • 0.02% A series adjusted so a total meets a published figure: a well's own cumulative from the official source, or a state's yearly total from a second official source.
  • 0.01% Published by the official source as its own estimate rather than an operator-attested figure
  • 0.01% The official source filed this volume for its reporting unit without naming the well. The well shown is our attribution, made only where a measured one-well ground identifies it; the volume itself is the source's own figure, untouched.

Every cubic foot in the reported months starts from what the official source published for those months. Measured over January 2010 to March 2026.

Gas figures for 10 countries and 13 US state totals stopped arriving, the latest of them after December 2024. The charts hold every month of their gas back until the feed is repaired. Their oil keeps arriving and stays in view.

Reported and estimated production through July 2026. The newest filings are arriving now, in the feed beside the chart.

About this chart

After March 2026, the filings already in are shown as reported; only the part not yet filed is estimated at each area's typical rate. Every area’s detail lives on the data pages; definitions in the methodology.

Source: CommoVision · the Americas, data through July 2026.

Every producing supply area in our coverage, 2025: full table best estimate incl. unsplit totals, allocated, source-estimated, source-withheld, rate-derived and attributed
Supply areaOil (MMbbl, 2025)Gas produced (Bcf, 2025)Share of output
Permian2405.810531.621.6%
Western Canada1775.97930.816.0%
Brazil Offshore1344.11995.410.3%
Appalachia69.113438.46.7%
Gulf of Mexico711756.85.3%
Mexico629.51681.65.1%
Eagle Ford4233032.34.3%
Bakken453.31306.63.8%
Niobrara2642012.92.8%
Alaska1543565.82.7%
Haynesville11.25510.62.6%
Venezuela355—2.5%
Vaca Muerta216.11306.82.1%
Colombia272.5459.22.1%
Guyana261.1378.92.0%
Anadarko130.82311.72.0%
Ecuador160.9—1.1%
California105.4112.40.8%
Mid-Continent42921.90.7%
Newfoundland & Labrador Offshore87.4219.80.7%
Gulf Coast Onshore62482.90.7%
Uinta63.3308.20.6%
Golfo San Jorge66.81250.5%
San Juan11.9748.20.4%
Green River5.9819.60.4%
Barnett7.5792.30.4%
Brazil Onshore31313.70.4%
Ark-La-Tex16.2295.70.2%
US: without per-well detail26.1105.60.2%
Other Rockies15.6255.30.2%
Austral3.9349.20.2%
Trinidad and Tobago18.7—0.1%
Peru16.1—0.1%
Rest of US5.380.80.1%
Cuba9.3—0.1%
Bolivia6.4—0.0%
Cuyana5.31.40.0%
Pacific OCS4.64.30.0%
Suriname4.4—0.0%
Noroeste1.139.60.0%
Black Warrior0.128.30.0%
Guatemala2—0.0%
Chile0.7—0.0%
Barbados0.4—0.0%
Belize0.3—0.0%
Rest of Canada01.70.0%

Share of output counts oil and gas together, gas at its market-value weight.

— means no figure is published for that period.

Source: CommoVision (commovision.com)

Countries, states, supply areas, companies

Browse the data

Pick any name. The panel shows what that page holds.

Pick a dimension to browse

Largest first, by latest complete year’s output, gas at its market-value weight

Largest by latest complete year’s output, gas at its market-value weight

  • United States : 2025 average: 13.67 MMbbl/d oil · 129.92 Bcf/d gas
  • Canada : 2025 average: 5.1 MMbbl/d oil · 22.34 Bcf/d gas
  • Brazil : 2025 average: 3.77 MMbbl/d oil · 6.33 Bcf/d gas
  • Mexico : 2025 average: 1.72 MMbbl/d oil · 4.61 Bcf/d gas
  • Argentina : 2025 average: 0.803 MMbbl/d oil · 4.99 Bcf/d gas

All A–Z (every one of the 18)

  • Argentina : 2025 average: 0.803 MMbbl/d oil · 4.99 Bcf/d gas
  • Barbados : 2025 average: 0.001 MMbbl/d oil
  • Belize : 2025 average: 0.000787 MMbbl/d oil
  • Bolivia : 2025 average: 0.0177 MMbbl/d oil
  • Brazil : 2025 average: 3.77 MMbbl/d oil · 6.33 Bcf/d gas
  • Canada : 2025 average: 5.1 MMbbl/d oil · 22.34 Bcf/d gas
  • Chile : 2025 average: 0.00197 MMbbl/d oil
  • Colombia : 2025 average: 0.747 MMbbl/d oil · 1.26 Bcf/d gas
  • Cuba : 2025 average: 0.0255 MMbbl/d oil
  • Ecuador : 2025 average: 0.441 MMbbl/d oil
  • Guatemala : 2025 average: 0.0054 MMbbl/d oil
  • Guyana : 2025 average: 0.715 MMbbl/d oil · 1.04 Bcf/d gas
  • Mexico : 2025 average: 1.72 MMbbl/d oil · 4.61 Bcf/d gas
  • Peru : 2025 average: 0.0442 MMbbl/d oil
  • Suriname : 2025 average: 0.0121 MMbbl/d oil
  • Trinidad and Tobago : 2025 average: 0.0512 MMbbl/d oil
  • United States : 2025 average: 13.67 MMbbl/d oil · 129.92 Bcf/d gas
  • Venezuela : 2025 average: 0.973 MMbbl/d oil

See all 18 countries →

Largest by latest complete year’s output, gas at its market-value weight

All A–Z (every one of the 25)

  • Alabama : 2025 average: 0.0086 MMbbl/d oil · 0.209 Bcf/d gas
  • Alaska : 2025 average: 0.422 MMbbl/d oil · 9.77 Bcf/d gas
  • Alberta : 2025 average: 4.34 MMbbl/d oil · 13.28 Bcf/d gas
  • Arkansas : 2025 average: 0.0067 MMbbl/d oil · 0.919 Bcf/d gas
  • British Columbia : 2025 average: 0.0504 MMbbl/d oil · 8.11 Bcf/d gas
  • California : 2025 average: 0.289 MMbbl/d oil · 0.308 Bcf/d gas
  • Colorado : 2025 average: 0.476 MMbbl/d oil · 5.19 Bcf/d gas
  • Gulf of Mexico : 2025 average: 1.95 MMbbl/d oil · 2.07 Bcf/d gas
  • Kansas : 2025 average: 0.0692 MMbbl/d oil · 0.329 Bcf/d gas
  • Louisiana : 2025 average: 0.0716 MMbbl/d oil · 10.12 Bcf/d gas
  • Manitoba : 2025 average: 0.0406 MMbbl/d oil · 0.0104 Bcf/d gas
  • Michigan : 2025 average: 0.011 MMbbl/d oil · 0.166 Bcf/d gas
  • Mississippi : 2025 average: 0.0275 MMbbl/d oil · 0.067 Bcf/d gas
  • Montana : 2025 average: 0.0776 MMbbl/d oil · 0.14 Bcf/d gas
  • New Mexico : 2025 average: 2.21 MMbbl/d oil · 11.19 Bcf/d gas
  • North Dakota : 2025 average: 1.17 MMbbl/d oil · 3.46 Bcf/d gas
  • Ohio : 2025 average: 0.137 MMbbl/d oil · 5.76 Bcf/d gas
  • Oklahoma : 2025 average: 0.407 MMbbl/d oil · 7.29 Bcf/d gas
  • Pacific OCS : 2025 average: 0.0126 MMbbl/d oil · 0.0119 Bcf/d gas
  • Pennsylvania : 2025 average: 0.0118 MMbbl/d oil · 21.48 Bcf/d gas
  • Saskatchewan : 2025 average: 0.434 MMbbl/d oil · 0.337 Bcf/d gas
  • Texas : 2025 average: 5.76 MMbbl/d oil · 37.39 Bcf/d gas
  • Utah : 2025 average: 0.186 MMbbl/d oil · 0.896 Bcf/d gas
  • West Virginia : 2025 average: 0.0405 MMbbl/d oil · 9.56 Bcf/d gas
  • Wyoming : 2025 average: 0.288 MMbbl/d oil · 3.6 Bcf/d gas

See all 25 states & provinces →

Largest by latest complete year’s output, gas at its market-value weight

All A–Z (every one of the 145)

  • Adams (CO) : 2025 average: 36.1 Mbbl/d oil · 0.147 Bcf/d gas
  • Alcona : 2025 average: 0.0098 Bcf/d gas
  • Allegheny : 2025 average: 0.0641 Mbbl/d oil · 0.426 Bcf/d gas
  • Alpena : 2025 average: 0.0141 Bcf/d gas
  • Andrews : 2025 average: 193.5 Mbbl/d oil · 0.414 Bcf/d gas
  • Antrim : 2025 average: 0.0138 Mbbl/d oil · 0.0308 Bcf/d gas
  • Armstrong (PA) : 2025 average: 0.0369 Mbbl/d oil · 0.508 Bcf/d gas
  • Atascosa : 2025 average: 77.1 Mbbl/d oil · 0.0754 Bcf/d gas
  • Baldwin (AL) : 2025 average: 0.112 Mbbl/d oil · 0.0515 Bcf/d gas
  • Belmont : 2025 average: 2.7 Mbbl/d oil · 1.37 Bcf/d gas
  • Bienville : 2025 average: 0.0757 Mbbl/d oil · 0.633 Bcf/d gas
  • Blaine (MT) : 2025 average: 0.685 Mbbl/d oil · 0.0061 Bcf/d gas
  • Blaine (OK) : 2025 average: 20.9 Mbbl/d oil · 0.667 Bcf/d gas
  • Bossier : 2025 average: 1.52 Mbbl/d oil · 0.788 Bcf/d gas
  • Bradford (PA) : 2025 average: 3.21 Bcf/d gas
  • Butler (PA) : 2025 average: 0.711 Mbbl/d oil · 0.705 Bcf/d gas
  • Caddo (LA) : 2025 average: 3.07 Mbbl/d oil · 2.15 Bcf/d gas
  • Campbell (WY) : 2025 average: 66.1 Mbbl/d oil · 0.372 Bcf/d gas
  • Canadian : 2025 average: 46.9 Mbbl/d oil · 1.21 Bcf/d gas
  • Carbon (UT) : 2025 average: 0.0583 Mbbl/d oil · 0.0726 Bcf/d gas
  • Carbon (WY) : 2025 average: 6.1 Mbbl/d oil · 0.206 Bcf/d gas
  • Carroll (OH) : 2025 average: 34 Mbbl/d oil · 0.386 Bcf/d gas
  • Carter (OK) : 2025 average: 23.5 Mbbl/d oil · 0.232 Bcf/d gas
  • Cleburne (AR) : 2025 average: 0.171 Bcf/d gas
  • Conecuh : 2025 average: 5 Mbbl/d oil · 0.0086 Bcf/d gas
  • Converse : 2025 average: 123.9 Mbbl/d oil · 0.295 Bcf/d gas
  • Conway : 2025 average: 0.164 Bcf/d gas
  • Crane : 2025 average: 45.8 Mbbl/d oil · 0.173 Bcf/d gas
  • Culberson : 2025 average: 139.3 Mbbl/d oil · 1.54 Bcf/d gas
  • Custer (OK) : 2025 average: 9.9 Mbbl/d oil · 0.303 Bcf/d gas
  • Dawson (TX) : 2025 average: 60.9 Mbbl/d oil · 0.0404 Bcf/d gas
  • De Soto : 2025 average: 0.142 Mbbl/d oil · 3.71 Bcf/d gas
  • Denton : 2025 average: 0.511 Mbbl/d oil · 0.358 Bcf/d gas
  • DeWitt : 2025 average: 138.8 Mbbl/d oil · 0.737 Bcf/d gas
  • Dimmit : 2025 average: 101.9 Mbbl/d oil · 0.599 Bcf/d gas
  • Divide : 2025 average: 40.1 Mbbl/d oil · 0.0576 Bcf/d gas
  • Doddridge : 2025 average: 1.77 Mbbl/d oil · 0.895 Bcf/d gas
  • Duchesne : 2025 average: 128.8 Mbbl/d oil · 0.23 Bcf/d gas
  • Dunn (ND) : 2025 average: 252.4 Mbbl/d oil · 0.51 Bcf/d gas
  • Ector : 2025 average: 55.2 Mbbl/d oil · 0.123 Bcf/d gas
  • Eddy (NM) : 2025 average: 976.2 Mbbl/d oil · 5.19 Bcf/d gas
  • Escambia (AL) : 2025 average: 0.82 Mbbl/d oil · 0.0071 Bcf/d gas
  • Fallon : 2025 average: 5.9 Mbbl/d oil · 0.0109 Bcf/d gas
  • Faulkner : 2025 average: 0.0613 Bcf/d gas
  • Finney : 2025 average: 4.1 Mbbl/d oil · 0.0197 Bcf/d gas
  • Fresno : 2025 average: 11.8 Mbbl/d oil · 0.0017 Bcf/d gas
  • Gaines : 2025 average: 47.6 Mbbl/d oil · 0.0587 Bcf/d gas
  • Garfield (CO) : 2025 average: 2.34 Mbbl/d oil · 0.84 Bcf/d gas
  • Garvin : 2025 average: 20.5 Mbbl/d oil · 0.333 Bcf/d gas
  • Glasscock : 2025 average: 156.7 Mbbl/d oil · 0.86 Bcf/d gas
  • Gonzales : 2025 average: 74.5 Mbbl/d oil · 0.0979 Bcf/d gas
  • Grady (OK) : 2025 average: 53.3 Mbbl/d oil · 1.1 Bcf/d gas
  • Grant (KS) : 2025 average: 0.315 Mbbl/d oil · 0.0441 Bcf/d gas
  • Greene (PA) : 2025 average: 0.0589 Mbbl/d oil · 3.14 Bcf/d gas
  • Guernsey : 2025 average: 44.5 Mbbl/d oil · 0.296 Bcf/d gas
  • Harding (NM) : 2025 average: 0.0781 Bcf/d gas
  • Harrison (OH) : 2025 average: 35.9 Mbbl/d oil · 1.03 Bcf/d gas
  • Harrison (TX) : 2025 average: 3.27 Mbbl/d oil · 1.42 Bcf/d gas
  • Harrison (WV) : 2025 average: 0.0946 Mbbl/d oil · 0.535 Bcf/d gas
  • Haskell (KS) : 2025 average: 4.92 Mbbl/d oil · 0.0201 Bcf/d gas
  • Howard (TX) : 2025 average: 271 Mbbl/d oil · 1.17 Bcf/d gas
  • Irion : 2025 average: 26.8 Mbbl/d oil · 0.397 Bcf/d gas
  • Jasper (MS) : 2025 average: 4.98 Mbbl/d oil · 0.00446 Bcf/d gas
  • Jefferson (AL) : 2025 average: 0.0201 Bcf/d gas
  • Jefferson (OH) : 2025 average: 0.194 Mbbl/d oil · 1.22 Bcf/d gas
  • Jefferson Davis (MS) : 2025 average: 0.155 Mbbl/d oil · 0.0137 Bcf/d gas
  • Jones (MS) : 2025 average: 4.75 Mbbl/d oil · 0.00321 Bcf/d gas
  • Karnes : 2025 average: 273.2 Mbbl/d oil · 0.843 Bcf/d gas
  • Kearny : 2025 average: 1 Mbbl/d oil · 0.0369 Bcf/d gas
  • Kenai Peninsula : 2025 average: 7.7 Mbbl/d oil · 0.193 Bcf/d gas
  • Kern : 2025 average: 211.1 Mbbl/d oil · 0.249 Bcf/d gas
  • Kingfisher : 2025 average: 37.1 Mbbl/d oil · 0.416 Bcf/d gas
  • La Plata : 2025 average: 0.0238 Mbbl/d oil · 0.523 Bcf/d gas
  • La Salle : 2025 average: 143 Mbbl/d oil · 0.966 Bcf/d gas
  • Lea : 2025 average: 1191.1 Mbbl/d oil · 4.32 Bcf/d gas
  • Lewis (WV) : 2025 average: 0.149 Mbbl/d oil · 0.461 Bcf/d gas
  • Live Oak : 2025 average: 58.1 Mbbl/d oil · 0.358 Bcf/d gas
  • Los Angeles : 2025 average: 31.8 Mbbl/d oil · 0.0159 Bcf/d gas
  • Loving : 2025 average: 488.1 Mbbl/d oil · 1.92 Bcf/d gas
  • Lycoming : 2025 average: 1.63 Bcf/d gas
  • Marion (WV) : 2025 average: 0.0073 Mbbl/d oil · 0.515 Bcf/d gas
  • Marshall (WV) : 2025 average: 13.2 Mbbl/d oil · 1.3 Bcf/d gas
  • Martin (TX) : 2025 average: 721.1 Mbbl/d oil · 2.08 Bcf/d gas
  • Matanuska-Susitna : 2025 average: 0.0066 Bcf/d gas
  • McKenzie : 2025 average: 365.7 Mbbl/d oil · 1.57 Bcf/d gas
  • McMullen : 2025 average: 80.7 Mbbl/d oil · 0.55 Bcf/d gas
  • Midland (TX) : 2025 average: 677.9 Mbbl/d oil · 2.72 Bcf/d gas
  • Mobile : 2025 average: 1.35 Mbbl/d oil · 0.046 Bcf/d gas
  • Monongalia : 2025 average: 0.0064 Mbbl/d oil · 0.822 Bcf/d gas
  • Monroe (OH) : 2025 average: 1.03 Mbbl/d oil · 0.932 Bcf/d gas
  • Monterey : 2025 average: 8.3 Mbbl/d oil · 0.00151 Bcf/d gas
  • Montmorency : 2025 average: 0.0141 Mbbl/d oil · 0.0446 Bcf/d gas
  • Mountrail : 2025 average: 221.7 Mbbl/d oil · 0.521 Bcf/d gas
  • Nacogdoches : 2025 average: 0.0759 Mbbl/d oil · 0.509 Bcf/d gas
  • Natchitoches : 2025 average: 0.0173 Mbbl/d oil · 0.337 Bcf/d gas
  • North Slope : 2025 average: 414.3 Mbbl/d oil · 9.57 Bcf/d gas
  • Otsego (MI) : 2025 average: 1.24 Mbbl/d oil · 0.0356 Bcf/d gas
  • Panola (TX) : 2025 average: 2.81 Mbbl/d oil · 1.74 Bcf/d gas
  • Pecos : 2025 average: 64.1 Mbbl/d oil · 0.276 Bcf/d gas
  • Phillips (MT) : 2025 average: 0.0151 Bcf/d gas
  • Pittsburg : 2025 average: 0.0221 Mbbl/d oil · 0.401 Bcf/d gas
  • Plaquemines : 2025 average: 16.1 Mbbl/d oil · 0.0198 Bcf/d gas
  • Reagan : 2025 average: 191.8 Mbbl/d oil · 1.39 Bcf/d gas
  • Red River (LA) : 2025 average: 0.0413 Mbbl/d oil · 1.4 Bcf/d gas
  • Reeves : 2025 average: 495.4 Mbbl/d oil · 3.35 Bcf/d gas
  • Richland (MT) : 2025 average: 45.8 Mbbl/d oil · 0.0643 Bcf/d gas
  • Rio Arriba : 2025 average: 4.92 Mbbl/d oil · 0.667 Bcf/d gas
  • Rio Blanco : 2025 average: 8.7 Mbbl/d oil · 0.242 Bcf/d gas
  • Ritchie : 2025 average: 2.66 Mbbl/d oil · 0.592 Bcf/d gas
  • Roger Mills : 2025 average: 17.3 Mbbl/d oil · 0.212 Bcf/d gas
  • Roosevelt (MT) : 2025 average: 18 Mbbl/d oil · 0.0233 Bcf/d gas
  • Sabine (LA) : 2025 average: 0.0626 Mbbl/d oil · 0.523 Bcf/d gas
  • San Augustine : 2025 average: 0.036 Mbbl/d oil · 0.73 Bcf/d gas
  • San Juan (NM) : 2025 average: 21.3 Mbbl/d oil · 0.776 Bcf/d gas
  • San Juan (UT) : 2025 average: 8.8 Mbbl/d oil · 0.0277 Bcf/d gas
  • Sevier (UT) : 2025 average: 2.52 Mbbl/d oil
  • Smith (MS) : 2025 average: 2.42 Mbbl/d oil · 0.00452 Bcf/d gas
  • Stephens (OK) : 2025 average: 22.5 Mbbl/d oil · 0.327 Bcf/d gas
  • Stevens (KS) : 2025 average: 0.591 Mbbl/d oil · 0.0497 Bcf/d gas
  • Sublette : 2025 average: 7.4 Mbbl/d oil · 1.66 Bcf/d gas
  • Sullivan (PA) : 2025 average: 0.646 Bcf/d gas
  • Susquehanna : 2025 average: 3.76 Bcf/d gas
  • Sweetwater : 2025 average: 8.7 Mbbl/d oil · 0.58 Bcf/d gas
  • Tarrant : 2025 average: 0.0062 Mbbl/d oil · 0.761 Bcf/d gas
  • Tioga (PA) : 2025 average: 1.35 Bcf/d gas
  • Tuscaloosa : 2025 average: 0.0003 Mbbl/d oil · 0.064 Bcf/d gas
  • Tyler (WV) : 2025 average: 4.3 Mbbl/d oil · 1.53 Bcf/d gas
  • Uintah : 2025 average: 44.6 Mbbl/d oil · 0.539 Bcf/d gas
  • Upton : 2025 average: 297.4 Mbbl/d oil · 1.26 Bcf/d gas
  • Van Buren (AR) : 2025 average: 0.199 Bcf/d gas
  • Ventura : 2025 average: 12.1 Mbbl/d oil · 0.0132 Bcf/d gas
  • Ward (TX) : 2025 average: 176.6 Mbbl/d oil · 0.594 Bcf/d gas
  • Washington (PA) : 2025 average: 7.3 Mbbl/d oil · 3.17 Bcf/d gas
  • Washington (TX) : 2025 average: 20.4 Mbbl/d oil · 0.254 Bcf/d gas
  • Wayne (MS) : 2025 average: 4.4 Mbbl/d oil · 0.0159 Bcf/d gas
  • Webb : 2025 average: 57.1 Mbbl/d oil · 3.34 Bcf/d gas
  • Weld : 2025 average: 389.4 Mbbl/d oil · 2.98 Bcf/d gas
  • Westmoreland (PA) : 2025 average: 0.02 Mbbl/d oil · 1.12 Bcf/d gas
  • Wetzel : 2025 average: 4.6 Mbbl/d oil · 2.01 Bcf/d gas
  • White (AR) : 2025 average: 0.168 Bcf/d gas
  • Williams (ND) : 2025 average: 243.8 Mbbl/d oil · 0.75 Bcf/d gas
  • Winkler : 2025 average: 73.4 Mbbl/d oil · 0.215 Bcf/d gas
  • Wise (TX) : 2025 average: 1.43 Mbbl/d oil · 0.409 Bcf/d gas
  • Wyoming (PA) : 2025 average: 0.587 Bcf/d gas
  • Yoakum : 2025 average: 69.9 Mbbl/d oil · 0.163 Bcf/d gas

See all 145 counties →

Largest by latest complete year’s output, gas at its market-value weight

All A–Z (every one of the 30)

  • Alaska : 2025 average: 0.422 MMbbl/d oil · 9.77 Bcf/d gas
  • Anadarko : 2025 average: 0.358 MMbbl/d oil · 6.33 Bcf/d gas
  • Appalachia : 2025 average: 0.189 MMbbl/d oil · 36.82 Bcf/d gas
  • Ark-La-Tex : 2025 average: 0.0443 MMbbl/d oil · 0.81 Bcf/d gas
  • Austral : 2025 average: 0.0108 MMbbl/d oil · 0.957 Bcf/d gas
  • Bakken : 2025 average: 1.24 MMbbl/d oil · 3.58 Bcf/d gas
  • Barnett : 2025 average: 0.0206 MMbbl/d oil · 2.17 Bcf/d gas
  • Black Warrior : 2025 average: 0.000293 MMbbl/d oil · 0.0776 Bcf/d gas
  • Brazil Offshore : 2025 average: 3.68 MMbbl/d oil · 5.47 Bcf/d gas
  • Brazil Onshore : 2025 average: 0.085 MMbbl/d oil · 0.86 Bcf/d gas
  • California : 2025 average: 0.289 MMbbl/d oil · 0.308 Bcf/d gas
  • Cuyana : 2025 average: 0.0145 MMbbl/d oil · 0.00371 Bcf/d gas
  • Eagle Ford : 2025 average: 1.16 MMbbl/d oil · 8.31 Bcf/d gas
  • Golfo San Jorge : 2025 average: 0.183 MMbbl/d oil · 0.343 Bcf/d gas
  • Green River : 2025 average: 0.0161 MMbbl/d oil · 2.25 Bcf/d gas
  • Gulf Coast Onshore : 2025 average: 0.17 MMbbl/d oil · 1.32 Bcf/d gas
  • Gulf of Mexico : 2025 average: 1.95 MMbbl/d oil · 2.07 Bcf/d gas
  • Haynesville : 2025 average: 0.0307 MMbbl/d oil · 15.1 Bcf/d gas
  • Mexico Offshore : 2025 average: 1.12 MMbbl/d oil · 2.22 Bcf/d gas
  • Mexico Onshore : 2025 average: 0.6 MMbbl/d oil · 2.39 Bcf/d gas
  • Mid-Continent : 2025 average: 0.115 MMbbl/d oil · 2.53 Bcf/d gas
  • Niobrara : 2025 average: 0.723 MMbbl/d oil · 5.51 Bcf/d gas
  • Noroeste : 2025 average: 0.00296 MMbbl/d oil · 0.109 Bcf/d gas
  • Other Rockies : 2025 average: 0.0426 MMbbl/d oil · 0.699 Bcf/d gas
  • Pacific OCS : 2025 average: 0.0126 MMbbl/d oil · 0.0119 Bcf/d gas
  • Permian : 2025 average: 6.59 MMbbl/d oil · 28.85 Bcf/d gas
  • San Juan : 2025 average: 0.0325 MMbbl/d oil · 2.05 Bcf/d gas
  • Uinta : 2025 average: 0.174 MMbbl/d oil · 0.844 Bcf/d gas
  • Vaca Muerta : 2025 average: 0.592 MMbbl/d oil · 3.58 Bcf/d gas
  • Western Canada : 2025 average: 4.87 MMbbl/d oil · 21.73 Bcf/d gas

See all 30 supply areas →

Largest by latest complete year’s output, gas at its market-value weight

All A–Z (every one of the 118)

See all 118 companies →

Five differences

Why CommoVision

Built from more than 200 public sources across the Americas, standardized into one model and checked against the sources’ own totals. The web portal opens on October 1, 2026; a real API and MCP access for AI tools open the same day. Request early access.

  • Complete the Americas, well by well

    Oil and gas production in full: conventional and shale, onshore and offshore, every producing country in the Americas. 1.1+ million producing wells, and permits, completions, fracs, formation tops, tests and surveys behind them. Where a source publishes at a coarser grain, the page says so.

  • Accurate checked against the source’s own totals

    Volumes are checked against the totals their sources publish, and the United States series against the EIA’s, region by region. A figure that includes allocated, adjusted, source-estimated, source-withheld, rate-derived or attributed volumes is labeled a best estimate, judged at its grain. The methodology is public.

  • Fresh watched continuously

    Every source check is recorded, and new filings enter the product as soon as their source publishes them. Every arrival on this site is timed in the open, step by step. The times are measured to be driven down.

  • Forward the view past the last filing

    A forward monthly profile, built well by well: forecasts for 1.1+ million producing wells, rebuilt as new volumes arrive and summed to the level you are looking at. Supply simulations are coming.

  • Open open about the data, open to your tools

    Every data page names its sources and how current it is. An API and an MCP endpoint (the open standard AI assistants use to reach live data) open on October 1, 2026. The numbers land in your models, notebooks and sheets. Request early access.

What we cover: 4.34M wells · 218 Bbbl of oil · 1,669 Tcf of gas · 10 data domains: see all, and where we cover them
  • 491,574,418 well-months

    Production

    Monthly oil, gas and water per well, plus facility-grain volumes where wells are not reported individually.

    28 regions · back to 1947

  • 4,338,141

    Wells

    Location, operator, status, trajectory, depth and completion dates. The spine every other table hangs off.

    31 regions

  • 2,556,185

    Permits

    Drilling permits as they are filed: the earliest public signal of what an operator intends to drill.

    18 regions

  • 2,578,173 completion records

    Completions

    Perforated intervals, treatment and first-production detail for the wells that reach the tank.

    18 regions

  • 425,005

    Frac jobs

    Water, proppant and additive volumes per treatment.

    21 regions

  • 5,083,284 formation picks

    Formation tops

    Depth picks that tie a well to the rock it produces from.

    13 regions

  • 8,106,628 test results

    Well tests

    Deliverability and pressure tests filed over each well's life.

    9 regions

  • 73,023,903 survey stations

    Directional surveys

    The measured path of the wellbore, station by station, in three dimensions.

    17 regions

  • 129,501,517 forecast well-months

    Forecasts

    A forward monthly profile for 1.1+ million producing wells, rebuilt as new volumes arrive.

    28 regions

  • 73,486

    Companies

    Operators resolved across name changes and acquisitions, so a company's history stays whole.
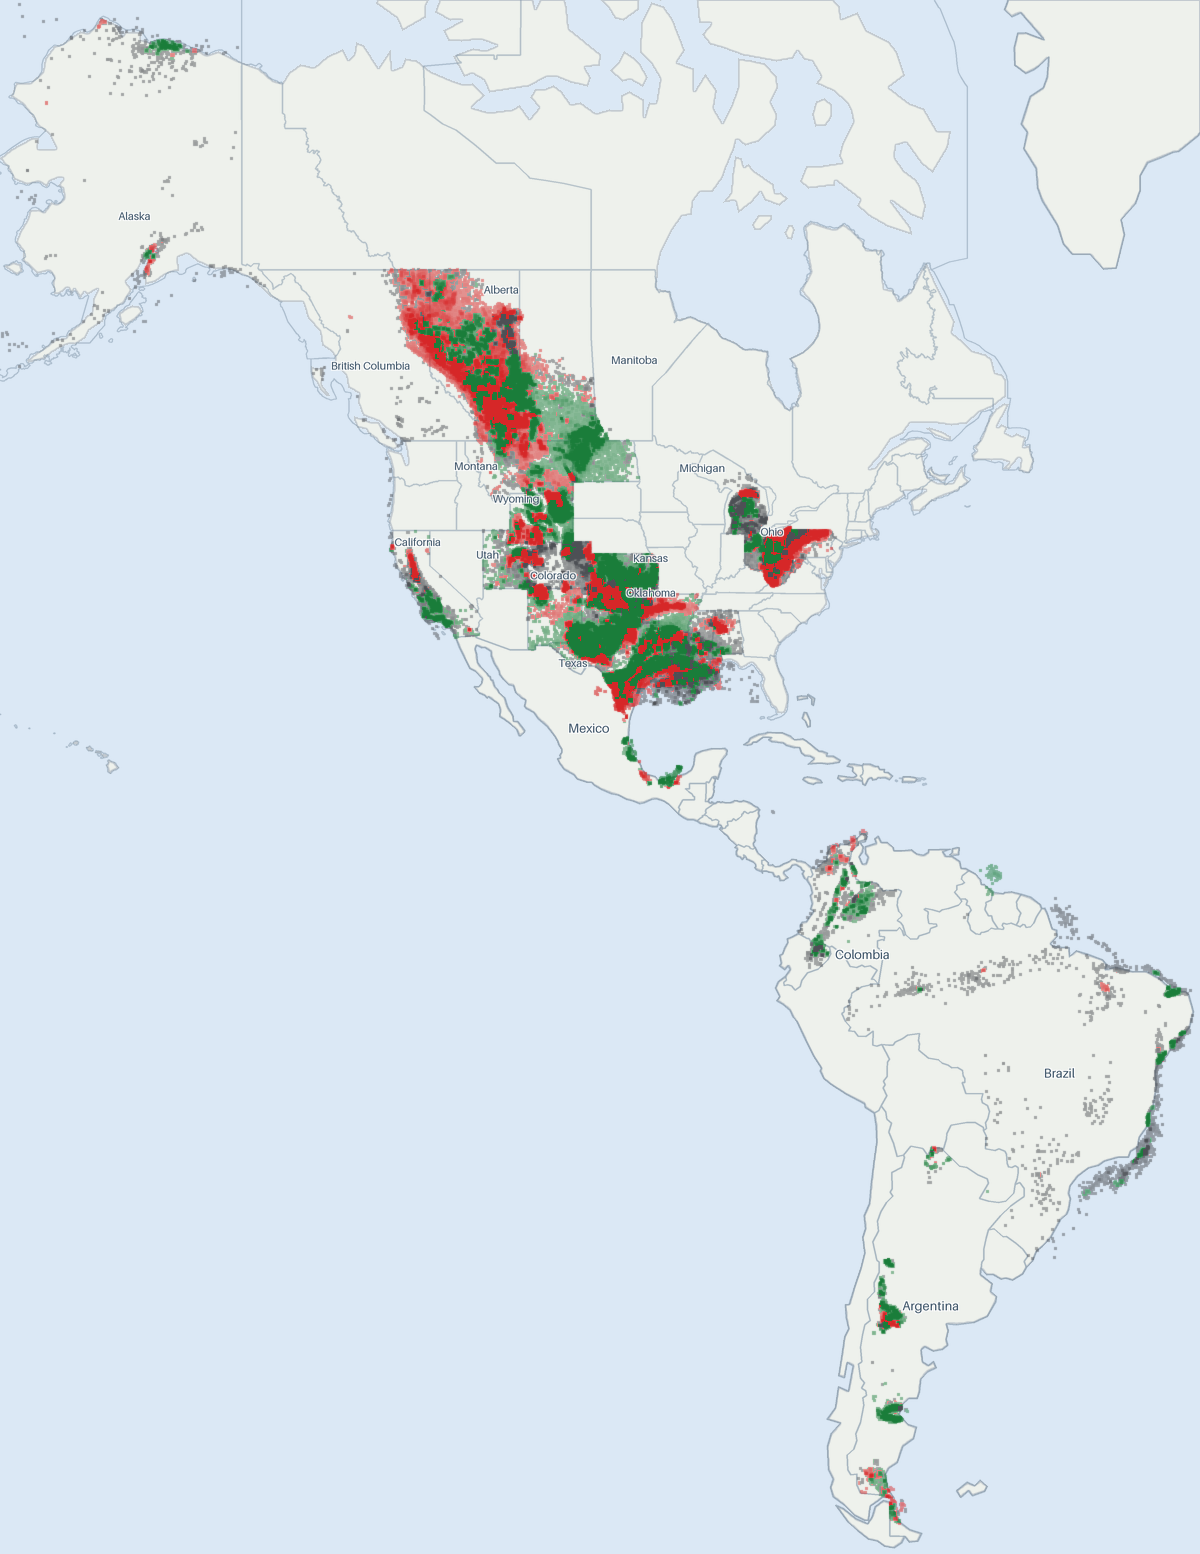
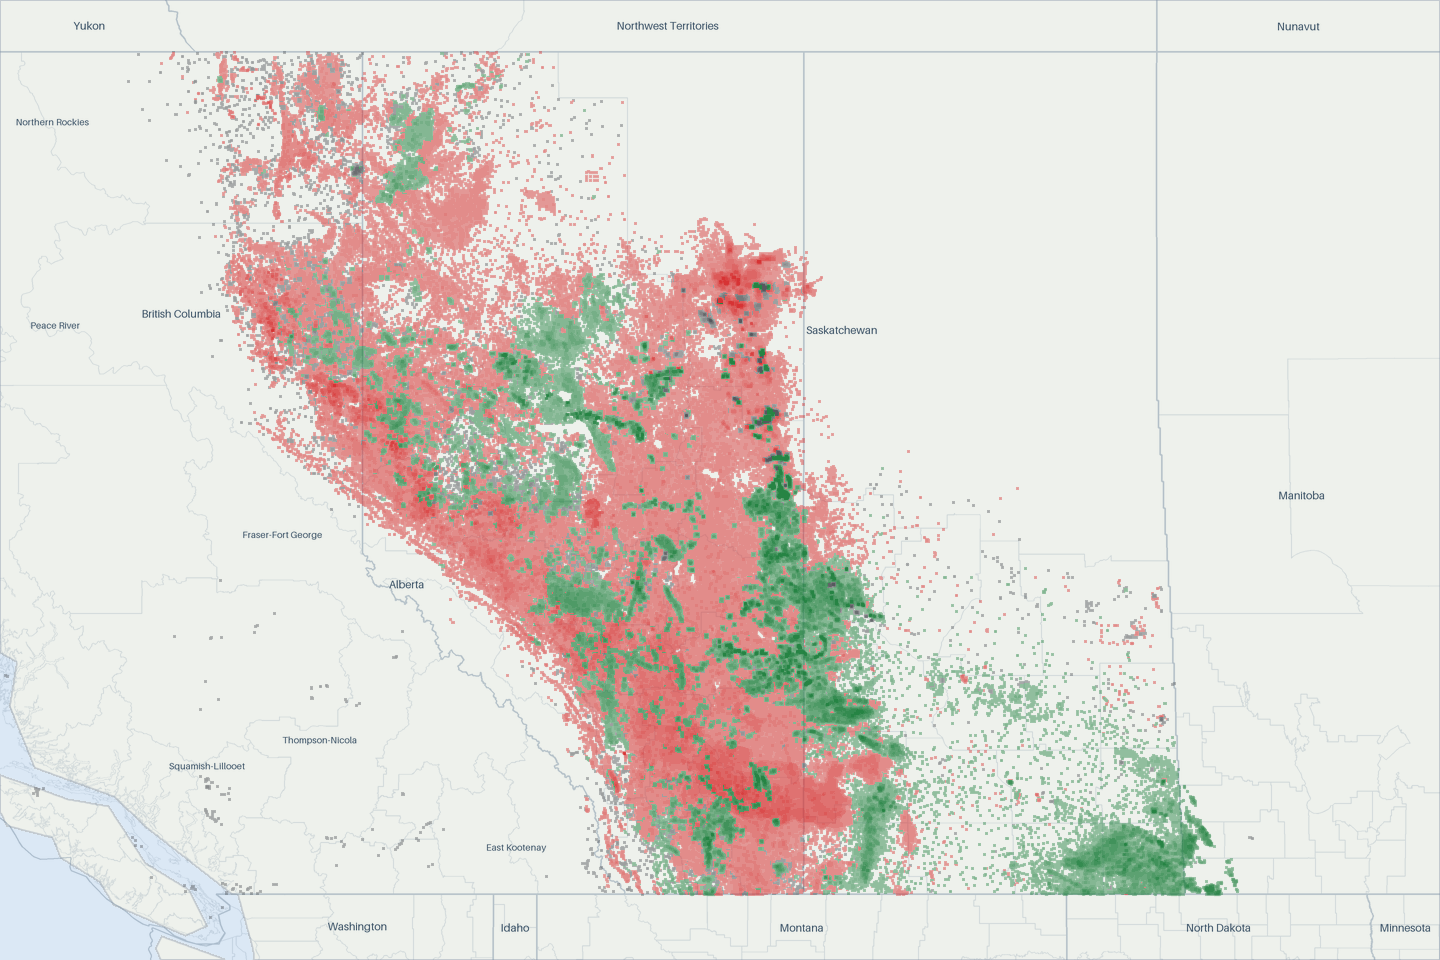
A map of the Americas showing 4,225,420 well locations for which CommoVision holds a published surface coordinate, each drawn where it is and colored by its primary product (green for oil, red for natural gas, gray where undetermined; a spot shared by more than one product shows the one with the most wells there), on a ground of land and water, with faint country, state and province outlines and place names for orientation.
  • Oil 2,164,875
  • Natural gas 1,347,463
  • Undetermined 713,082
4,225,420 well locations. Wells in United States, Canada, Argentina, Brazil, Colombia, Mexico, Ecuador, Guyana. Production held above well grain is published at that grain: Barbados, Bolivia, Belize, Chile, Cuba, Guatemala, Peru, Suriname, Trinidad and Tobago, Venezuela. 112,721 further wells we track sit outside this frame: their source publishes no coordinate, or their location falls beyond its edges. We publish production for 10,258 of them.

The full coverage matrix lists every published production series with its grain, source, basis and data-through month.

Subscriptions

Pricing

  • We offer subscriptions to view, analyze and download our data, billed per organization on an annual term.
  • Tiered plans will be published here at the launch of our portal; each begins with a 14-day free trial.
  • Subscriptions renew automatically and can be canceled effective at the end of the term. See our Refunds & Cancellation policy.
  • Pay by card or bank transfer, processed securely by Stripe. We never store your full card details.

The portal opens on October 1, 2026

Request early access and you get a 3-week free trial: a week more than our standard 14 days. Billing follows with published tiers; nothing is billed before then. Get in touch.

The company

Contact

CommoVision was founded by Enno Peters, who earlier founded ShaleProfile. It returns to a simple idea: production data should be complete, traceable to the filing it came from, and fast. Every arrival on this site is timed in the open, step by step. Everything here runs on the live production system. Write to us; we read and answer personally.

Get in touch

Data use is subject to our Terms of Service.